British engineers have designed a post-processing algorithm that could give imaging specialists a better view of the orbital cavity and its surrounding structures with MRI. Beth Vokurka from the University of Manchester presented her group’s findings at the recent Computer Assisted Radiology and Surgery conference in San Francisco.
"There’s a classic dilemma in eye imaging. You can either use a surface coil to look at the superficial bits of the orbit with good signal-to-noise ratio, or you can look at the entire orbit, all the way down to the cavity of the sinus, but that sacrifices the signal-to-noise ratio," said Vokurka, a research assistant at the university’s imaging science and biomedical engineering department.
One solution to this problem is to use dedicated, multi-element phased-array coils, but they are both expensive and not widely available, Vokurka added.
The Manchester team came up with a post-processing system designed to automatically detect and correct non-uniformity in images.
"This non-parametric normalization algorithm assumes that coil heterogeneity will result in smooth shifts in intensity, which can be detected within homogenous tissue. The aim of this study was to specifically examine the properties of normalized images obtained with surface coils," they said (CARS 2000 Proceedings, pp.325-330).
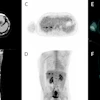
Scans, 40 in all, were taken on a 1.5-tesla ACS-NT (Philips Medical Systems). The orbit was scanned using a T1-weighted gradient-echo volume sequence. The images were obtained using a standard head coil, a flexible 8-cm surface coil, and two prototype miniature circular coils with diameters of 5 cm and 2.5 cm. A 9-cm field of view with a matrix of 256 x 256 was used for all images. The slice thickness varied from 2 mm to 6 mm.
Blinded readers assessed the images for quality. In order to determine overall image quality, the mean and variance of signal intensity in the anterior and posterior eyeball were calculated. The imaging characteristics of identical tissues in varying depths were then compared.
Both readers rated non-uniformity-corrected, 3 mm-slice images obtained with the 2.5-cm coil as the best for optic nerve imaging, Vokurka reported. The highest-ranking surface coil image was the non-uniformity corrected, 6-mm thick slice from the 8-cm coil. The uncorrected head coil images with a 5-mm slice thickness provided the clearest image of the cavernous sinus and the orbital apex. Overall, the ranking for non-uniformity-corrected surface coil images was higher than for the equivalent uncorrected images, the group reported.
Based on the quantitative measurement of tissue contrast, the uncorrected 5-cm surface coil images had significant separation in intensity distribution with respect to the depth of the tissue. After non-uniformity correction, the intensities of the two regions of the globe became statistically similar. Only corrected images provided significant contrast between the mid retro-orbital fat and temporalis muscle, Vokurka said.
The software for this algorithm, called TINA, is available for free at the Neuro-image Analysis Centre Web site, although it is for design purposes only and currently has no clinical application, Vokurka said.
By Shalmali Pal
AuntMinnie.com staff writer
July 24, 2000
Let AuntMinnie.com know what you think about this story.
Copyright © 2000 AuntMinnie.com