Bayer Schering Pharma of Berlin and Hamamatsu Photonics of Hamamatsu, Japan, have signed a licensing agreement to share their products and expertise in molecular imaging for cancer.
Under the pact, Bayer Schering Pharma will acquire the worldwide exclusive rights for research, development, and commercialization of a group of molecules that specifically bind to malignant tumor cells.
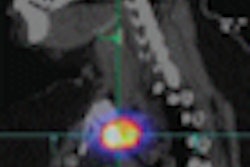
The tracers are labeled with a short-life radionuclide and can be employed for PET imaging. These new PET tracers could help enhance the differentiation of malignant tumors from benign tissue alterations and allow more precise staging of cancer.
Related Reading
Bayer Schering, Epix to end Vasovist partnership, September 4, 2008
Bayer awarded Amerinet deal, April 14, 2008
Bayer announces ship date for VistaTrak, March 13, 2008
Bayer inks molecular imaging deal, February 20, 2008
Bayer launches VistaTrak at RSNA show, December 3, 2007
Copyright © 2009 AuntMinnie.com


![Overview of the study design. (A) The fully automated deep learning framework was developed to estimate body composition (BC) (defined as subcutaneous adipose tissue [SAT] in liters; visceral adipose tissue [VAT] in liters; skeletal muscle [SM] in liters; SM fat fraction [SMFF] as a percentage; and intramuscular adipose tissue [IMAT] in deciliters) from MRI. The fully automated framework comprised one model (model 1) to quantify different BC measures (SAT, VAT, SM, SMFF, and IMAT) as three-dimensional (3D) measures from whole-body MRI scans. The second model (model 2) was trained to identify standardized anatomic landmarks along the craniocaudal body axis (z coordinate field), which allowed for subdividing the whole-body measures into different subregions typically examined on clinical routine MRI scans (chest, abdomen, and pelvis). (B) BC was quantified from whole-body MRI in over 66,000 individuals from two large population-based cohort studies, the UK Biobank (UKB) (36,317 individuals) and the German National Cohort (NAKO) (30,291 individuals). Bar graphs show age distribution by sex and cohort. BMI = body mass index. (C) After the performance assessment of the fully automated framework, the change in BC measures, distributions, and profiles across age decades were investigated. Age-, sex-, and height-adjusted body composition reference curves were calculated and made publicly available in a web-based z-score calculator (https://circ-ml.github.io).](https://img.auntminnieeurope.com/mindful/smg/workspaces/default/uploads/2026/05/body-comp.XgAjTfPj1W.jpg?auto=format%2Ccompress&fit=crop&h=112&q=70&w=112)


