Children undergoing MR or CT imaging are often unsure of what the exams will entail and thus anxious about them. To overcome their fears, an Italian radiographer has created two free-to-download booklets that can help them better understand these procedures.
Giuseppe Scappatura, from the Grande Ospedale Metropolitano Bianchi Melacrino Morelli in Reggio Calabria, wrote the
Giuseppe Scappatura of the Grande Ospedale Metropolitano Bianchi Melacrino Morelli in Reggio Calabria, Italy.
"In my daily work in radiology, I often meet children who arrive frightened because they don't know what to expect," he said. "This fear can make the examination more difficult for both them and the staff."
The two illustrated booklets are called "Sofia and the Magic Machine" (for MRI) and "The Portal of Images" (for CT). Scappatura produced printed copies and gifted them to the pediatrics and pediatric hematology-oncology departments of his hospital. The booklets are written from a child's point of view, he said, "to help children feel like the protagonists of the story and turn the exam into a moment of discovery." They are in both Italian and English.
"Sofia and the Magic Machine" explains what happens before, during, and after an MRI exam in a clear and reassuring way, according to Scappatura, helping children manage fears related to the machine's noises, emphasizing the need to stay still, and describing the proximity of the coil.
"The Portal of Images" presents CT as
"The Portal of Images"
The booklets not only help children undergoing these exams, but also their parents or guardians, he noted.
"Parents can feel more prepared to guide their child through the experience with greater peace of mind," he said.
Scappatura hopes the booklets will transform the CT and MR imaging experience "into a story … an adventure filled with discoveries, smiles, and teamwork," he told AuntMinnieEurope.
"Explaining things with simple and reassuring words helps children feel like the heroes of the story," he said.
The booklets are free to download, Scappatura noted.




![Overview of the study design. (A) The fully automated deep learning framework was developed to estimate body composition (BC) (defined as subcutaneous adipose tissue [SAT] in liters; visceral adipose tissue [VAT] in liters; skeletal muscle [SM] in liters; SM fat fraction [SMFF] as a percentage; and intramuscular adipose tissue [IMAT] in deciliters) from MRI. The fully automated framework comprised one model (model 1) to quantify different BC measures (SAT, VAT, SM, SMFF, and IMAT) as three-dimensional (3D) measures from whole-body MRI scans. The second model (model 2) was trained to identify standardized anatomic landmarks along the craniocaudal body axis (z coordinate field), which allowed for subdividing the whole-body measures into different subregions typically examined on clinical routine MRI scans (chest, abdomen, and pelvis). (B) BC was quantified from whole-body MRI in over 66,000 individuals from two large population-based cohort studies, the UK Biobank (UKB) (36,317 individuals) and the German National Cohort (NAKO) (30,291 individuals). Bar graphs show age distribution by sex and cohort. BMI = body mass index. (C) After the performance assessment of the fully automated framework, the change in BC measures, distributions, and profiles across age decades were investigated. Age-, sex-, and height-adjusted body composition reference curves were calculated and made publicly available in a web-based z-score calculator (https://circ-ml.github.io).](https://img.auntminnieeurope.com/mindful/smg/workspaces/default/uploads/2026/05/body-comp.XgAjTfPj1W.jpg?auto=format%2Ccompress&fit=crop&h=100&q=70&w=100)


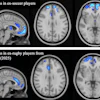
![Overview of the study design. (A) The fully automated deep learning framework was developed to estimate body composition (BC) (defined as subcutaneous adipose tissue [SAT] in liters; visceral adipose tissue [VAT] in liters; skeletal muscle [SM] in liters; SM fat fraction [SMFF] as a percentage; and intramuscular adipose tissue [IMAT] in deciliters) from MRI. The fully automated framework comprised one model (model 1) to quantify different BC measures (SAT, VAT, SM, SMFF, and IMAT) as three-dimensional (3D) measures from whole-body MRI scans. The second model (model 2) was trained to identify standardized anatomic landmarks along the craniocaudal body axis (z coordinate field), which allowed for subdividing the whole-body measures into different subregions typically examined on clinical routine MRI scans (chest, abdomen, and pelvis). (B) BC was quantified from whole-body MRI in over 66,000 individuals from two large population-based cohort studies, the UK Biobank (UKB) (36,317 individuals) and the German National Cohort (NAKO) (30,291 individuals). Bar graphs show age distribution by sex and cohort. BMI = body mass index. (C) After the performance assessment of the fully automated framework, the change in BC measures, distributions, and profiles across age decades were investigated. Age-, sex-, and height-adjusted body composition reference curves were calculated and made publicly available in a web-based z-score calculator (https://circ-ml.github.io).](https://img.auntminnieeurope.com/mindful/smg/workspaces/default/uploads/2026/05/body-comp.XgAjTfPj1W.jpg?auto=format%2Ccompress&fit=crop&h=112&q=70&w=112)