
CT can assist in identifying patients who are likely to suffer an ischemic stroke after undergoing left atrial appendage occlusion, French researchers have reported in an article published on 5 September in Radiology.
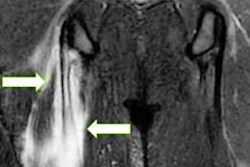
How does the modality do this? By helping clinicians assess what is called "hypoattenuation thickening" on the device implanted during the procedure to prevent blood clots, wrote a team led by Dr. Xavier Iriart, of Bordeaux University Hospital in Bordeaux-Pessac, France.
"[We found that] high-grade hypoattenuation thickening was associated with ... higher risk of subsequent stroke over a median follow-up of 17 months," the group noted.
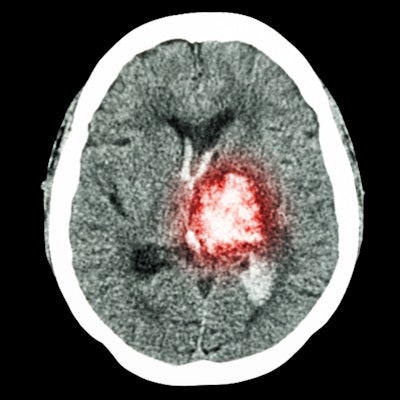
Irregular heartbeat contributes to 15% to 20% of all ischemic strokes and is associated with an enlargement of the heart's left atrium, Iriart and colleagues explained. This enlargement can cause clots to form and increase the risk of stroke. The left atrial appendage occlusion procedure involves surgically implanting a device to prevent clots from escaping from this enlarged area of the heart.
Hypoattenuation thickening on the device is a common finding on follow-up CT after a patient undergoes left atrial appendage occlusion, but the clinical implications of this thickening are unclear (1 mm to 3 mm hypoattenuation thickening is considered low-grade, while thickening of 3 mm or more is considered high-grade).
The investigators sought to investigate any links between hypoattenuation thickening grade at follow-up CT with outcomes in patients who underwent left atrial appendage occlusion between January 2012 and November 2020. Their study included 412 participants considered to be at high risk of stroke.
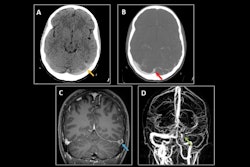
Two radiologists evaluated post-procedure CT images and classified any identified hypoattenuation thickening as low grade or high grade; the researchers assessed the association of hypoattenuation thickening grade and stroke incidence.
Of the study participants, 24% had low-grade and 5% had high-grade hypoattenuation thickening at four-month follow-up. After median follow-up period of 17 months, 5.8% of participants suffered a stroke. Having high-grade hypoattenuation thickening increased a patient's odds of stroke fourfold compared with low-grade thickening (hazard ratio, 4.6 compared with 0.94, with 1 as reference).
High-grade hypoattenuation thickening was more frequently identified in patients "in whom antithrombotic therapy had been discontinued, and was associated with higher stroke risks," the team noted.
"These findings support the introduction of ... standardized CT criteria for hypoattenuation thickening grading, with important implications for treatment regimen optimization after implantation," the authors concluded.
The complete study can be found here.


![Overview of the study design. (A) The fully automated deep learning framework was developed to estimate body composition (BC) (defined as subcutaneous adipose tissue [SAT] in liters; visceral adipose tissue [VAT] in liters; skeletal muscle [SM] in liters; SM fat fraction [SMFF] as a percentage; and intramuscular adipose tissue [IMAT] in deciliters) from MRI. The fully automated framework comprised one model (model 1) to quantify different BC measures (SAT, VAT, SM, SMFF, and IMAT) as three-dimensional (3D) measures from whole-body MRI scans. The second model (model 2) was trained to identify standardized anatomic landmarks along the craniocaudal body axis (z coordinate field), which allowed for subdividing the whole-body measures into different subregions typically examined on clinical routine MRI scans (chest, abdomen, and pelvis). (B) BC was quantified from whole-body MRI in over 66,000 individuals from two large population-based cohort studies, the UK Biobank (UKB) (36,317 individuals) and the German National Cohort (NAKO) (30,291 individuals). Bar graphs show age distribution by sex and cohort. BMI = body mass index. (C) After the performance assessment of the fully automated framework, the change in BC measures, distributions, and profiles across age decades were investigated. Age-, sex-, and height-adjusted body composition reference curves were calculated and made publicly available in a web-based z-score calculator (https://circ-ml.github.io).](https://img.auntminnieeurope.com/mindful/smg/workspaces/default/uploads/2026/05/body-comp.XgAjTfPj1W.jpg?auto=format%2Ccompress&fit=crop&h=100&q=70&w=100)


![Overview of the study design. (A) The fully automated deep learning framework was developed to estimate body composition (BC) (defined as subcutaneous adipose tissue [SAT] in liters; visceral adipose tissue [VAT] in liters; skeletal muscle [SM] in liters; SM fat fraction [SMFF] as a percentage; and intramuscular adipose tissue [IMAT] in deciliters) from MRI. The fully automated framework comprised one model (model 1) to quantify different BC measures (SAT, VAT, SM, SMFF, and IMAT) as three-dimensional (3D) measures from whole-body MRI scans. The second model (model 2) was trained to identify standardized anatomic landmarks along the craniocaudal body axis (z coordinate field), which allowed for subdividing the whole-body measures into different subregions typically examined on clinical routine MRI scans (chest, abdomen, and pelvis). (B) BC was quantified from whole-body MRI in over 66,000 individuals from two large population-based cohort studies, the UK Biobank (UKB) (36,317 individuals) and the German National Cohort (NAKO) (30,291 individuals). Bar graphs show age distribution by sex and cohort. BMI = body mass index. (C) After the performance assessment of the fully automated framework, the change in BC measures, distributions, and profiles across age decades were investigated. Age-, sex-, and height-adjusted body composition reference curves were calculated and made publicly available in a web-based z-score calculator (https://circ-ml.github.io).](https://img.auntminnieeurope.com/mindful/smg/workspaces/default/uploads/2026/05/body-comp.XgAjTfPj1W.jpg?auto=format%2Ccompress&fit=crop&h=112&q=70&w=112)


