Synthetic CT images show almost perfect concordance with real ones for visualizing cystic fibrosis (CF)-related lung changes -- and have even better image quality than ultrashort echo time lung MRI. That's the key finding of new research from France.
The results could improve patient care, wrote a team led by Arthur Longuefosse, PhD, of the Université Bordeaux Segalen. The findings were published on 5 July in Radiology.
"[Synthetic] CT could enhance MRI as a 'one-stop shop' ionizing radiation-free examination, with the possibility to combine high-resolution morphologic features with functional information in a reasonable acquisition time of less than 15 minutes," the researchers explained.
CT has been the traditional modality for structural, or morphologic, imaging of the lung. But it uses radiation, and for patients who must undergo repeated imaging, repeated CT exams can pose a problem in terms of exposure. Lung imaging using MRI with ultrashort echo times (UTE) produces high-resolution morphologic imaging and does not impart radiation. But its image quality lags behind CT, the team noted.
AI shows promise for solving clinical problems like these, Longuefosse and colleagues explained.
"Recently, deep learning models with generative adversarial networks have been developed and provide a framework for estimating generative models," they wrote. "Among the potential applications of GANs, MRI-to-CT translations are possible."
Longuefosse and colleagues investigated whether synthetic CT images created using a generative adversarial network (GAN) algorithm to process short-echo MRI images could serve as a viable alternative for imaging cystic fibrosis. The team trained the GAN on paired MRI and CT sections and tested it along with an external set of data.
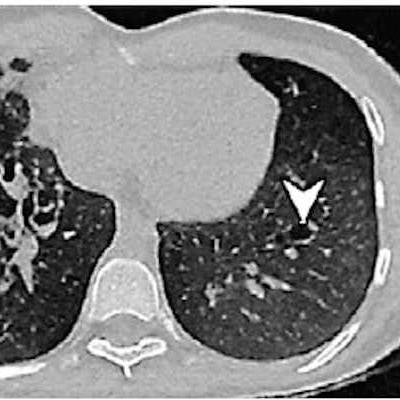
 Example images of the lung in a 21-year-old male patient with cystic fibrosis from the external validation data set. (A) Scan acquired with lung MRI with ultrashort echo time (UTE) shows motion artifacts on the right side (arrows). These artifacts were not observed on (B) the synthetic CT image generated by artificial intelligence from the UTE MRI scan, and the rest of the reconstructed image was not affected. Bronchiectasis of the left lower lobe (arrowhead) was visually missed at UTE MRI, leading to a false-negative depiction of bronchiectasis, but it is clearer on the synthetic CT scan and confirmed on the (C) corresponding real CT scan. Images and caption courtesy of the RSNA.
Next, the investigators conducted a study that included 110 patients with cystic fibrosis who underwent both short-echo MRI and CT on the same day between January 2018 and December 2022. The training set consisted of 82 patients and was seeded with 33,002 paired MRI and CT exams; the test set included 28 patients; and the external data set included 46 patients.
The researchers assessed image quality by measuring contrast-to-noise and signal-to-noise ratios and overall noise, as well as features such as artifacts. They found that synthetic CT's performance bested both real CT and MRI when it came to contrast-to-noise ratio and overall noise.
| Synthetic CT performance for imaging cystic fibrosis (test set) | |||
| Measure | Ultra short echo MRI | Real CT | Synthetic CT |
| Contrast-to-noise ratio | 9.3 | 247 | 303 |
| Signal-to-noise ratio | 88 | 88 | 88 |
| Overall noise | 22 | 42 | 26 |
These results could expand clinicians' toolkit clinicians for diagnosis and tracking of cystic fibrosis, according to Languefosse and colleagues.
"Synthetic CT appeared to enhance the applicability of lung MRI in the clinical setting ... [and] may open the door to a new era of lung imaging without continuing dependence on ionizing radiation, which may be applicable to diseases beyond CF, and perhaps beyond the chest," the team concluded.
The complete study can be found here.