
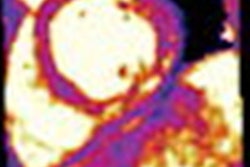
Cardiac MRI indicates that myocarditis associated with the COVID-19 vaccine shows a similar pattern compared to myocarditis caused by other factors, but is milder, according to a study published February 15 in Radiology.
Myocarditis is inflammation of the heart muscle and can be caused by viral infections. It has been reported as a complication of mRNA-based COVID-19 vaccines.
Since cardiac MRI is typically used to assess myocarditis, a team led by Dr. Matteo Fronza of the University of Toronto in Canada sought to investigate the pattern and extent of myocarditis findings in individuals who had been vaccinated for COVID-19.
The team conducted a study that included 92 adults with myocarditis and abnormalities on cardiac MRI. Patients were categorized as follows:
- Those who developed myocarditis after COVID-19 vaccination
- Those who developed myocarditis after COVID-19 illness
- Those who developed myocarditis due to non-COVID-19 factors
Fronza's group found that 22% of the patients had myocarditis after receiving the COVID-19 vaccine, while 11% had the condition after being ill with COVID-19 and 66% developed it from non-COVID-19 causes.
But the abnormal cardiac MRI findings were less severe in patients with myocarditis after receiving the COVID-19 vaccine, while those who developed the condition after COVID-19 illness or via other causes had a "higher prevalence of abnormalities involving the interventricular septum and worse myocardial injury measured by T1 mapping," the investigators noted.


![Overview of the study design. (A) The fully automated deep learning framework was developed to estimate body composition (BC) (defined as subcutaneous adipose tissue [SAT] in liters; visceral adipose tissue [VAT] in liters; skeletal muscle [SM] in liters; SM fat fraction [SMFF] as a percentage; and intramuscular adipose tissue [IMAT] in deciliters) from MRI. The fully automated framework comprised one model (model 1) to quantify different BC measures (SAT, VAT, SM, SMFF, and IMAT) as three-dimensional (3D) measures from whole-body MRI scans. The second model (model 2) was trained to identify standardized anatomic landmarks along the craniocaudal body axis (z coordinate field), which allowed for subdividing the whole-body measures into different subregions typically examined on clinical routine MRI scans (chest, abdomen, and pelvis). (B) BC was quantified from whole-body MRI in over 66,000 individuals from two large population-based cohort studies, the UK Biobank (UKB) (36,317 individuals) and the German National Cohort (NAKO) (30,291 individuals). Bar graphs show age distribution by sex and cohort. BMI = body mass index. (C) After the performance assessment of the fully automated framework, the change in BC measures, distributions, and profiles across age decades were investigated. Age-, sex-, and height-adjusted body composition reference curves were calculated and made publicly available in a web-based z-score calculator (https://circ-ml.github.io).](https://img.auntminnieeurope.com/mindful/smg/workspaces/default/uploads/2026/05/body-comp.XgAjTfPj1W.jpg?auto=format%2Ccompress&fit=crop&h=112&q=70&w=112)


