
Connected healthcare specialist Wellbeing Software and software developer Contextflow have joined forces to deliver clinical decision-support software to radiologists in the U.K. through Wellbeing's AI Connect Marketplace.
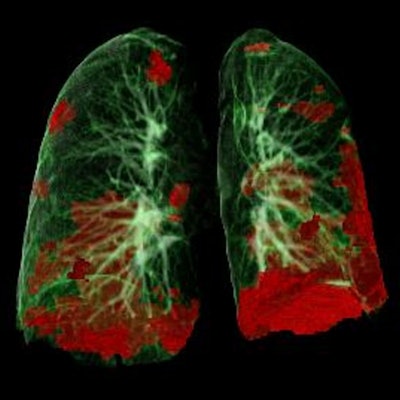
Contextflow's core technology is 3D image-based clinical decision-support software called contextflow Search Lung CT. The system is designed to help save time while increasing reporting quality and confidence, the companies said.
Search Lung CT provides quantitative and qualitative image analysis results for 19 lung-specific imaging patterns, including nodule detection in chest CT scans, and provides statistics, reference cases, and differential diagnoses directly into PACS workstations, the companies said.
The technology integration will be managed through Wellbeing's AI Connect gateway, which allows hospitals to embed their chosen algorithms into radiology workflows regardless of the radiology information system or PACS they are running, Wellbeing said.


![Overview of the study design. (A) The fully automated deep learning framework was developed to estimate body composition (BC) (defined as subcutaneous adipose tissue [SAT] in liters; visceral adipose tissue [VAT] in liters; skeletal muscle [SM] in liters; SM fat fraction [SMFF] as a percentage; and intramuscular adipose tissue [IMAT] in deciliters) from MRI. The fully automated framework comprised one model (model 1) to quantify different BC measures (SAT, VAT, SM, SMFF, and IMAT) as three-dimensional (3D) measures from whole-body MRI scans. The second model (model 2) was trained to identify standardized anatomic landmarks along the craniocaudal body axis (z coordinate field), which allowed for subdividing the whole-body measures into different subregions typically examined on clinical routine MRI scans (chest, abdomen, and pelvis). (B) BC was quantified from whole-body MRI in over 66,000 individuals from two large population-based cohort studies, the UK Biobank (UKB) (36,317 individuals) and the German National Cohort (NAKO) (30,291 individuals). Bar graphs show age distribution by sex and cohort. BMI = body mass index. (C) After the performance assessment of the fully automated framework, the change in BC measures, distributions, and profiles across age decades were investigated. Age-, sex-, and height-adjusted body composition reference curves were calculated and made publicly available in a web-based z-score calculator (https://circ-ml.github.io).](https://img.auntminnieeurope.com/mindful/smg/workspaces/default/uploads/2026/05/body-comp.XgAjTfPj1W.jpg?auto=format%2Ccompress&fit=crop&h=112&q=70&w=112)


