
A compact 3D color digital x-ray scanner developed by a New Zealand radiologist and his father is entering global clinical trials, according to a statement released by the University of Otago in Dunedin.
Prof. Anthony Butler, PhD, and his father, Phil Butler, PhD, began developing the MARS scanner more than 10 years ago using technology adapted from the European Organization for Nuclear Research (CERN). The device produces high-resolution 3D, color images of the hand and wrist with details of a CT but with tissue health and composition data usually only available with MRI and PET scans, the university said.
Clinical trials for the scanner will begin in 2021 in Christchurch and Lausanne University Hospital in Switzerland, the university said. The trials will be managed by MARS Bioimaging -- the company founded to bring the MARS scanner to market -- and the University of Canterbury in Christchurch and will include up to 150 patients.
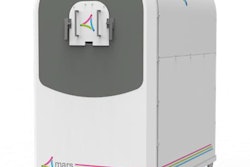
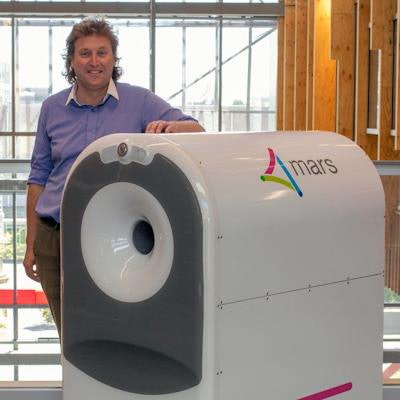
Butler with his MARS wrist scanner. Image courtesy of the University of Otago.Preclinical versions of the device are already in research use, Butler said in a statement released by the university. And the device performed well in a 2019 pilot study with orthopedic patients.
"Pending regulatory approvals, the wrist scanners could be available for clinical use within the next year," he said.


![Overview of the study design. (A) The fully automated deep learning framework was developed to estimate body composition (BC) (defined as subcutaneous adipose tissue [SAT] in liters; visceral adipose tissue [VAT] in liters; skeletal muscle [SM] in liters; SM fat fraction [SMFF] as a percentage; and intramuscular adipose tissue [IMAT] in deciliters) from MRI. The fully automated framework comprised one model (model 1) to quantify different BC measures (SAT, VAT, SM, SMFF, and IMAT) as three-dimensional (3D) measures from whole-body MRI scans. The second model (model 2) was trained to identify standardized anatomic landmarks along the craniocaudal body axis (z coordinate field), which allowed for subdividing the whole-body measures into different subregions typically examined on clinical routine MRI scans (chest, abdomen, and pelvis). (B) BC was quantified from whole-body MRI in over 66,000 individuals from two large population-based cohort studies, the UK Biobank (UKB) (36,317 individuals) and the German National Cohort (NAKO) (30,291 individuals). Bar graphs show age distribution by sex and cohort. BMI = body mass index. (C) After the performance assessment of the fully automated framework, the change in BC measures, distributions, and profiles across age decades were investigated. Age-, sex-, and height-adjusted body composition reference curves were calculated and made publicly available in a web-based z-score calculator (https://circ-ml.github.io).](https://img.auntminnieeurope.com/mindful/smg/workspaces/default/uploads/2026/05/body-comp.XgAjTfPj1W.jpg?auto=format%2Ccompress&fit=crop&h=112&q=70&w=112)


