A one-day training program effectively improves the sensitivity of radiologists when reading CT colonography (CTC) exams, according to a study published on 9 June in Clinical Radiology.
Most radiologists who interpret CT colonography are trained to do so, but performance is variable, noted a group of researchers led by Dr. Anu Obaro of St. Mark's Hospital in Harrow, U.K. Obaro's team conducted a randomized study to investigate variations in interpretation accuracy of these exams and whether a one-day, structured training protocol could improve the sensitivity of experienced readers.
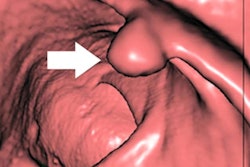
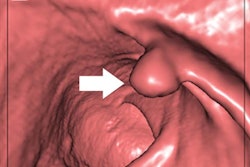
The study included 139 radiologists from 72 hospitals who interpreted CT colonography studies in their daily practice. The investigators randomized participants into an intervention group (one day of training and regular feedback) and a control group. They evaluated readers' sensitivity for polyps 6 mm or larger on 10 CT colonography scans at baseline exam, and at one, six, and 12 months. The primary outcome the group measured was any differences in sensitivity at the one-month checkpoint.
Obaro and colleagues found that baseline sensitivity was similar between the two study groups (intervention, 49.7%, and control, 43.6%). However, the training intervention improved performance at the one-month follow-up, with a sensitivity rate of 66.3% among the radiologists who underwent the training and a rate of 44.5% among those who did not (p < 0.001). This improvement lasted through the six-month check (intervention group sensitivity rate, 66.1%; control group sensitivity rate, 49.6%).
"One-day training and regular feedback significantly increases experienced CTC radiologist sensitivity for polyps [6 mm and larger], an effect sustained to at least six months," the researchers wrote.