Carbon-11 (C-11) PET that targets translocator protein (TSPO) expression in the joint lining tissue of the knee may be a better way to determine the extent of rheumatoid arthritis (RA), according to a study published in the July issue of the Journal of Nuclear Medicine.
The researchers from the U.K. used the TSPO radioligand C-11 PBR28, which is designed to image macrophage infiltration. TSPO is highly expressed on activated macrophages, or immune cells responding to inflammation. Thus, sites where TSPO was expressed showed significantly greater signal on PET imaging of inflammation due to rheumatoid arthritis (JNM, July 2018, Vol. 59:7, pp. 1125-1132).
"TSPO-targeted imaging has long been used as a means of imaging macrophage infiltration in vivo," said lead author Nehal Narayan of the University of Oxford in a statement from the Society of Nuclear Medicine and Molecular Imaging (SNMMI). "Here we present the first-ever analysis of TSPO expression in the major constituents of RA pannus (inflamed synovium), demonstrating that TSPO PET likely acts as an imaging tool of not only macrophages but also activated synovial fibroblasts, a cell group increasingly recognized to play a critical role in RA inflammation."
The study included three rheumatoid arthritis patients and three healthy volunteers who underwent PET scans of both knees using C-11 PBR28. The researchers also analyzed the cellular expression of TSPO in the joint lining tissue of the six subjects, as well as in three additional RA patients and three more healthy patients who were undergoing knee arthroscopy.
In addition, Narayan and colleagues evaluated TSPO messenger RNA (mRNA) expression and hydrogen-3 (H-3) PBR28 radioligand binding using in vitro monocytes, macrophages, fibroblast-like synoviocytes, and CD4+ T-lymphocytes.
The researchers observed significantly higher C-11 PBR28 PET signal in rheumatoid arthritis joints compared with healthy joints. They also found that H-3 PBR28-specific binding in the joint lining tissue was approximately 10 times greater in RA patients than in healthy controls.
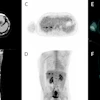
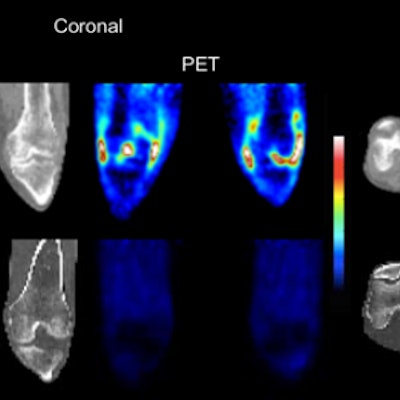
 CT and C-11 PBR28 PET of both knees of (i, top row) an RA patient with clinical signs of synovitis in both knees and (ii, bottom row) a healthy control. Images courtesy of Narayen et al and JNM.
"The utility of TSPO-targeted PET as an imaging tool for inflammation is based on the notion of high TSPO expression on activated macrophages," the authors wrote. "Our observation that TSPO is expressed on all major cell groups in rheumatoid arthritis pannus could explain why TSPO PET has been found to be a highly sensitive indicator of synovitis, being superior to MRI in detecting subclinical joint inflammation."
Because joint inflammation isn't always controlled by current treatments in patients with RA, new approaches are needed, Narayan noted.
"This work demonstrates that TSPO PET is able to act as a means of imaging not only synovial macrophages but also activated synovial fibroblasts. ... Indeed, there has been recent interest in targeting activated fibroblasts as a novel targeted treatment strategy for RA," she added.