Radiologists and radiographers are vital players in the fight to curb osteoporosis because they identify vertebral fractures early, according to the U.K.'s National Osteoporosis Society.
Every year osteoporosis causes 500,000 broken bones and costs the National Health Service (NHS) 1.1 billion pounds (1.25 billion euros). The National Osteoporosis Society is tackling the problem by publishing new guidance designed to help diagnostic imaging professionals identify more vertebral fractures -- and it's calling on them to make a concerted effort to note and report any that they spot.
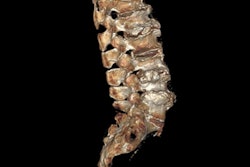
"Radiologists and radiographers are missing opportunities to identify patients at risk of osteoporosis every day because they are not reporting the vertebral fractures that can be seen on scans -- fractures that often indicate that a patient will go on to suffer more pain and misery and cost the already overburdened NHS more in terms of care and support," said National Osteoporosis Society Clinical Director Fizz Thompson.
The guidance may be downloaded from the society's website.


![Overview of the study design. (A) The fully automated deep learning framework was developed to estimate body composition (BC) (defined as subcutaneous adipose tissue [SAT] in liters; visceral adipose tissue [VAT] in liters; skeletal muscle [SM] in liters; SM fat fraction [SMFF] as a percentage; and intramuscular adipose tissue [IMAT] in deciliters) from MRI. The fully automated framework comprised one model (model 1) to quantify different BC measures (SAT, VAT, SM, SMFF, and IMAT) as three-dimensional (3D) measures from whole-body MRI scans. The second model (model 2) was trained to identify standardized anatomic landmarks along the craniocaudal body axis (z coordinate field), which allowed for subdividing the whole-body measures into different subregions typically examined on clinical routine MRI scans (chest, abdomen, and pelvis). (B) BC was quantified from whole-body MRI in over 66,000 individuals from two large population-based cohort studies, the UK Biobank (UKB) (36,317 individuals) and the German National Cohort (NAKO) (30,291 individuals). Bar graphs show age distribution by sex and cohort. BMI = body mass index. (C) After the performance assessment of the fully automated framework, the change in BC measures, distributions, and profiles across age decades were investigated. Age-, sex-, and height-adjusted body composition reference curves were calculated and made publicly available in a web-based z-score calculator (https://circ-ml.github.io).](https://img.auntminnieeurope.com/mindful/smg/workspaces/default/uploads/2026/05/body-comp.XgAjTfPj1W.jpg?auto=format%2Ccompress&dpr=2&fit=crop&h=167&q=70&w=250)


