With the help of diffusion-weighted MR imaging (DWI-MRI), researchers in Italy have uncovered changes in the visual systems of patients newly diagnosed with Parkinson's disease, according to a study published online 11 July in Radiology.
The findings suggest that such changes in a patient's visual system could provide biomarkers to help detect the disease early and monitor its progress.
Parkinson's disease is a neurodegenerative condition caused by neuronal loss in several brain structures. It is characterized by tremors, rigidity or stiffness throughout the body, and impaired balance and coordination. However, nonmotor symptoms, such as an inability to perceive colors, a change in visual acuity, and a decrease in blinking, may also be present in Parkinson's patients.
"Although Parkinson's disease is primarily considered a motor disorder, several studies have shown nonmotor symptoms are common across all stages of the disease," said lead author Dr. Alessandro Arrigo, a resident in ophthalmology at the University Vita-Salute San Raffaele in Milan, in a statement from the RSNA. "However, these symptoms are often undiagnosed because patients are unaware of the link to the disease and, as a result, they may be undertreated."
Subjects were recruited from January 2013 to December 2014 for the study, which involved a team of researchers from ophthalmology, neurology, and neuroradiology. There were 20 newly diagnosed and not yet treated patients with Parkinson's disease, along with 20 age- and gender-matched healthy controls.
Three-tesla MRI scans (Achieva, Philips Healthcare) were performed on the healthy controls and patients, who underwent imaging within four weeks of their diagnosis. Arrigo and colleagues used DWI to assess white-matter changes and voxel-based morphometry to determine concentration changes of the brain's gray and white matter. All study participants also had ophthalmologic exams.
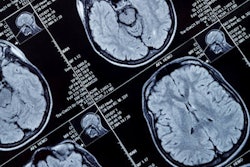
The group found statistically significant abnormalities within the visual system brain structures of patients with Parkinson's disease, compared with the healthy control subjects. These included changes in optic radiations, reduced white-matter concentration, and reduced optic chiasm volume.
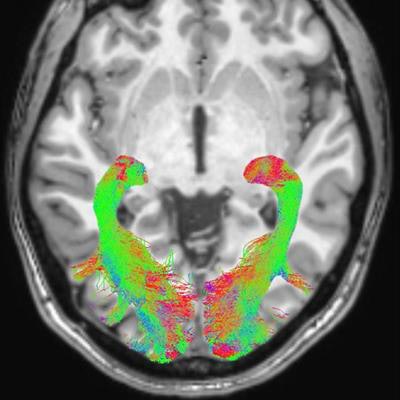
 Left and right optic radiation image is overlaid onto a T1-weighted axial volume image. Optic radiation images were obtained based on diffusion-weighted volume images through constrained spherical deconvolution fitting and related tractography. Each bundle was automatically colored according to tract main directionality: red for left to right, green for anterior to posterior, and blue for inferior to superior. Image courtesy of the RSNA.
"This protocol could be used for longitudinal studies to help understand the progression of visual alterations in the course of the disease and to assess positive or negative effects of pharmacologic treatments on visual structures," the authors wrote.
Because the study did not include specific neurologic-ophthalmologic exams, additional studies should be performed to confirm these findings and to correlate them with clinical neurologic-ophthalmologic assessment, they noted.