German researchers are developing an imaging method that uses a ligand labeled with F-18 to target glycoprotein (GP) IIb/IIIa receptors, potentially improving the visualization of blood clots in veins and arteries, according to a preclinical study published in the July issue of the Journal of Nuclear Medicine.
Researchers from Berlin-based Bayer and Piramal Imaging reported that their novel small molecule PET tracer, F-18 GP1, showed strong accumulation at the site of thrombus formation in monkeys. In addition, the radiotracer's binding ability was not affected by anticoagulants such as aspirin and heparin (JNM, July 2017, Vol. 58:7, pp. 1094-1099).
Most importantly, the ligand enabled the detection of small venous and arterial clots, endothelial damage, and emboli in the brain.
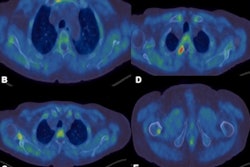
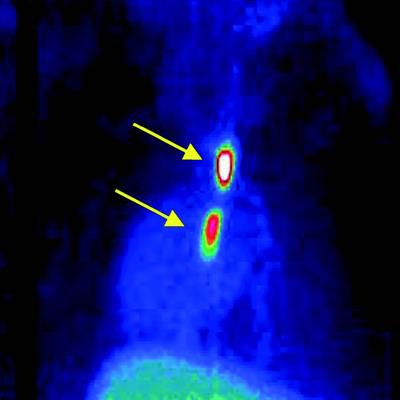
 PET images of three monkeys show strong signals detected at the sites where inserted catheters had roughened surfaces. Almost no other background signal is visible. Only accumulation in the gallbladder becomes visible at the bottom of the image. Images courtesy of Piramal Imaging and JNM.
"A single imaging modality that could visualize thrombi from various sources in different anatomic regions would be very valuable," Dr. Andrew Stephens, PhD, chief medical officer at Piramal Imaging, said in a statement.
Due to the favorable preclinical results, a first-in-human study of F-18 GP1 is currently underway.