Researchers in Canada have found that an automated breast density measurement software outperforms conventional risk factors for predicting the risk of cancer, according to research published on 20 January by the British Journal of Radiology.
In a study of 392 women with breast cancer and 817 age-matched controls, radiologists at Dalhousie University in Nova Scotia, Canada, compared automated breast density measurements with traditional breast cancer risk factors including age, family history, and menopausal status, in order to determine which approach is a better predictor of breast cancer.
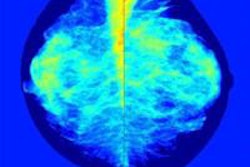
The automated density measures were obtained using DM-Research (Densitas) software that provides breast density measurements from full-field digital mammography images. Densitas received a CE Mark for the software last November. Data on clinical risk factors for each patient was obtained from the provincial breast-imaging information system of the Nova Scotia Health Authority.
The predictive power of each approach was measured using multivariable logistic regression that compared the receiver-operating characteristic (AUROC) curve to evaluate the performance of three measures, clinical risk only, density measurements only, and clinical and density measurements combined. The combined measure slightly outperformed density, and significantly outperformed risk factors alone.
- Clinical risk factors only: AUROC 0.535
- Density-related measures. only: AUROC of 0.622
- Clinical risk factors and density-related measures together: AUROC of 0.632.
The combined model generated an AUROC of 0.632 and performed significantly better than the risk factor model (p
"Digital imaging generates massive quantities of valuable information, but much of it is overlooked," said Dr. Sian Iles, section head of breast imaging at the IWK Health Centre, and associate professor of radiology at Dalhousie University.
Densitas said an advantage of its software is the capability of analyzing presentation images that are routinely available on a PACS network.