Finnish researchers are using functional MRI (fMRI) to show how patients who have experienced one previous psychotic episode process information differently than healthy people.
Studies of psychosis often include chronically ill patients who tend to show more obvious differences in brain activity on fMRI. Early psychosis, on the other hand, can be more difficult to detect, according to the group led by Eva Rikandi, PhD, from Aalto University.
To provide the same brain stimuli to all subjects in the study, the participants were asked watched Tim Burton's "Alice in Wonderland." Using a 3-tesla MRI scanner, the researchers imaged the brains of 46 patients who had experienced only one psychotic event and 32 healthy controls, while the subjects watched the movie.
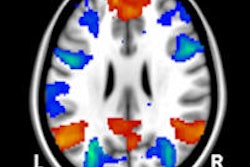
Functional MRI showed significant differences in the precuneus region of the brain, which is associated with memory, visuospatial awareness, self-awareness, and other aspects of consciousness, in the psychotic patients versus the controls.
Rikandi said the study achieved nearly 80% classification accuracy. The findings were presented at the annual European College of Neuropsychopharmacology (ECNP) conference in Amsterdam.


![Overview of the study design. (A) The fully automated deep learning framework was developed to estimate body composition (BC) (defined as subcutaneous adipose tissue [SAT] in liters; visceral adipose tissue [VAT] in liters; skeletal muscle [SM] in liters; SM fat fraction [SMFF] as a percentage; and intramuscular adipose tissue [IMAT] in deciliters) from MRI. The fully automated framework comprised one model (model 1) to quantify different BC measures (SAT, VAT, SM, SMFF, and IMAT) as three-dimensional (3D) measures from whole-body MRI scans. The second model (model 2) was trained to identify standardized anatomic landmarks along the craniocaudal body axis (z coordinate field), which allowed for subdividing the whole-body measures into different subregions typically examined on clinical routine MRI scans (chest, abdomen, and pelvis). (B) BC was quantified from whole-body MRI in over 66,000 individuals from two large population-based cohort studies, the UK Biobank (UKB) (36,317 individuals) and the German National Cohort (NAKO) (30,291 individuals). Bar graphs show age distribution by sex and cohort. BMI = body mass index. (C) After the performance assessment of the fully automated framework, the change in BC measures, distributions, and profiles across age decades were investigated. Age-, sex-, and height-adjusted body composition reference curves were calculated and made publicly available in a web-based z-score calculator (https://circ-ml.github.io).](https://img.auntminnieeurope.com/mindful/smg/workspaces/default/uploads/2026/05/body-comp.XgAjTfPj1W.jpg?auto=format%2Ccompress&fit=crop&h=112&q=70&w=112)


