Breast imagers reading 2D images synthetically reconstructed from digital breast tomosynthesis (DBT) data had comparable performance to those reading conventional 2D mammography and DBT scans for breast cancer screening, while exposing women to less radiation dose, according to Norwegian researchers.
DBT has been making steady progress in breast imaging facilities, but many sites are reluctant to use the technology alone without reference to conventional full-field digital mammography (FFDM) studies. However, performing both DBT and FFDM scans on the same patient incurs additional radiation dose and adds to interpretation time.
 Dr. Per Skaane, PhD.
One solution is creating 2D mammography images from the 3D DBT data -- so-called "synthesized" 2D images -- via commercially available software. To evaluate the technique, a team led by Dr. Per Skaane, PhD, from the University of Oslo compared the diagnostic performance and radiation dose of conventional FFDM plus DBT with that of synthesized 2D images plus DBT for breast cancer screening.
"If DBT is to be widely used in screening mammography, dose-related issues will have to be carefully addressed," Skaane and colleagues wrote. "To date, to our knowledge, the use of synthesized 2D images has been investigated only in retrospective observer performance studies that used early versions of synthesized 2D images."
Oslo tomo trial
The study is part of the Oslo Tomosynthesis Screening Trial, which receives equipment and support from Hologic; Skaane's team used Hologic's C-View 2D imaging software and Selenia Dimensions 3D breast tomosynthesis system for the research.
The study was conducted in two periods: The first ran from November 2010 to December 2011 and included 12,631 women, while the second ran from January 2012 to December 2012 and included 12,270 women, for a total of 24,901 exams. Two versions of reconstructed 2D images (corresponding to the two data-gathering periods) were compared in terms of cancer detection and false-positive rates to parallel FFDM plus DBT exams (Radiology, June 2014, Vol. 271:3, pp. 655-663).
Synthesized 2D exams produced during the first period were generated by an early version of C-View, while those in the second period were generated by an upgraded version, the authors wrote.
Eight radiologists interpreted the screening exams, using a five-point rating scale to measure the probability of cancer. Both reading modes included standard craniocaudal (CC) and mediolateral-oblique (MLO) views of each breast. All cases with a score of 2 or higher were discussed to reach consensus on whether the patient should be recalled.
False-positive scores and positive predictive values (PPVs) were comparable between the two periods and between the two imaging combinations, although synthesized 2D images plus DBT did slightly reduce false positives and increase PPV.
| Diagnostic performance of synthesized 2D DBT images | ||||
| Period 1 | Period 2 | |||
| FFDM + DBT | Synthesized 2D + DBT | FFDM + DBT | Synthesized 2D + DBT | |
| No. of false positives | 670 (5.3%) | 582 (4.6%) | 560 (4.6%) | 555 (4.5%) |
| No. of true positives | 101 | 94 | 96 | 94 |
| No. of cases recalled after arbitration | 351 | 310 | 296 | 269 |
| PPV | 28.5% | 30.3% | 32.1% | 34.9% |
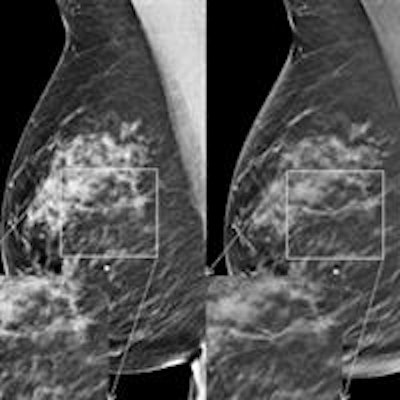
 Craniocaudal images in 57-year-old woman with 8-mm invasive ductal carcinoma in the left breast. Left: FFDM image; middle: initial synthesized 2D image; right: DBT image. The region of interest is magnified for each image. Reader scores were 1 for FFDM, 3 for FFDM plus DBT, and 4 for synthesized 2D images plus DBT. This case was from study period 1. All images courtesy of RSNA.
 Mediolateral oblique images in 61-year-old woman with 12-mm invasive lobular carcinoma in the right breast. Left: FFDM image; middle: current synthesized 2D image; right: DBT image. The region of interest is magnified for each image. Reader scores for the study were 1 for FFDM, 3 for FFDM plus DBT, and 4 for synthesized 2D images plus DBT. This case was from study period 2.
Skaane and colleagues also found comparable cancer detection rates between the two combinations:
- Period 1:
- FFDM + DBT: 101 cancers found, or 8.0 per 1,000 screening exams
- Synthesized 2D + DBT: 94 cancers found, or 7.4 per 1,000 screening exams
- Period 2:
- FFDM + DBT: 96 cancers found, or 7.8 per 1,000 screening exams
- Synthesized 2D + DBT: 94 cancers found, or 7.7 per 1,000 screening exams
As for radiation, using synthesized 2D images with DBT reduced women's exposure by 45%, compared with using DBT and conventional mammography. The average glandular dose for a single mammographic view was 1.58 mGy for FFDM and 1.95 mGy for DBT, for a combined dose of 3.53 mGy, while synthesized 2D images plus DBT remained at 1.95 mGy.
Having 2D mammography images in addition to the tomosynthesis images is important for many reasons, including the ability to compare priors to current exams, compare the right versus left breast, and provide current 2D exams to other institutions, according to Skaane and colleagues. And the evolution of synthesized 2D image software has made the use of these images with DBT even more viable for clinical practice.
"We believe that the use of a high-quality synthesized view plus DBT should be viewed as acceptable for replacing radiation dose-requiring FFDM projection images when interpreting screening mammography examinations," the authors concluded.