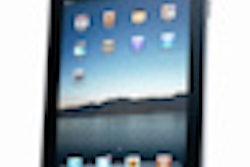
Both the iPhone 4 and iPad 2 can be employed by on-call neuroradiologists for evaluating acute stroke, according to research presented at the recent RSNA 2011 meeting in Chicago. The iPad 2 was judged to be the better option, however.
In a retrospective study involving nearly 150 cases, a Spanish research team found that radiologists using either of the popular Apple devices had sensitivity that equaled or surpassed that of readers using conventional PACS workstations. Reviewers appreciated the larger screen size of the iPad, however.
"In this case, size matters; the iPad is the preferred device," said presenter Dr. Fernando García, PhD, of Puerta de Hierro University Hospital in Madrid.
The researchers chose to evaluate the use of these mobile devices in acute stroke as a starting point for a planned installation of a teleradiology system in the future. Acute stroke evaluation is the most common head CT indication performed at their center; on average, 30 studies are performed each day, and these cases require accurate and fast evaluation, he said.
Apple mobile devices were used in the study because of their ubiquitous nature at the hospital and worldwide, García said. More than 20 million iPhones and 9 million iPads were sold in this year's third quarter, and there are 134 radiology applications for the iPhone and 75 for the iPad.
The team used the OsiriX HD DICOM image viewer given its easy access, low cost, and the familiarity of personnel with Mac OS, he said. The software can perform basic image manipulation and can display images up to 1,024 x 1,024.
The retrospective, longitudinal study included 149 adult patients who underwent a noncontrast head CT for suspicion of acute stroke. Of the 149, 74 were confirmed as positive cases on MRI and 75 were confirmed as negative on MRI and/or follow-up.
For the purposes of the study, the original reports produced by a neuroradiologist on a PACS workstation were used as the gold standard. The PACS workstation included two MDCC-2121 LCD displays (Barco).
Two general radiologists who usually read urgent neuroradiology cases reviewed the 149 cases using the iPhone 4 32 GB and iPad 2 32 GB. The first radiologist read the studies first with the iPad, and then with the iPhone three or more days later to reduce recall bias. The second radiologist interpreted the studies in a similar manner, but using the iPhone first.
The devices' display brightness was set to maximum and all images were reviewed in a luminance-controlled location. The DICOM images were transferred to the devices using a private wireless network.
Performance for detecting acute stroke
|
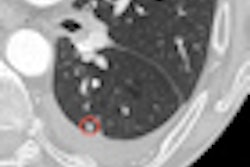
On both displays, both the first and second viewer detected acute stroke in the same 44 patients as found on the original PACS workstation, while the second viewer correctly found acute stroke in an additional patient. No false negatives were found.
Interobserver agreement for detecting acute stroke was very good, with a kappa value of 0.98, he said. Subjectively, the viewers gave the iPhone 4 an average mobile reporting experience score of 6.5 out of 10.
"They said it has a great contrast display but too small a screen," he said. "Too much time was needed to evaluate the study."
The iPad 2 was given an average score of 9 out of 10 for its mobile reporting experience. Viewers cited its ease of use and the ability to swiftly evaluate studies, García said.
"[They said] it's perfect to evaluate head CT out of the hospital," he said.
García noted that their research analyzed only the displays and their image manipulation capabilities, not the image display speed or other aspects.
"Apple mobile devices have high-quality displays with comparable luminosity, contrast, and even better pixel density than the professional LCD," he said. "But there are a few drawbacks that are very important. There is no possible calibration of the image, no contrast or luminance control, and there is no quality assurance over the display's life."
With regard to image manipulation capabilities, the study found that OsiriX HD is a good portable DICOM image viewer, allowing basic image manipulation with a satisfactory user experience, García said.
"[However], we consider it absolutely necessary to install a contrast test," he said.
The research team acknowledged a number of study limitations, including the use of nonconsecutive patients and only MRI-proven positive cases. There is also the possibility of study memorization because the same studies were evaluated twice, García said.
In addition, reporting conditions were not the same for the two general radiologists using the mobile devices and the neuroradiologists who produced the original report. The study also compared general radiologists with neuroradiologists, he said.