Scottish researchers are using PET imaging to analyze heart valves and discover which patients may need open heart surgery or other appropriate treatment, according to a study in the journal Circulation.
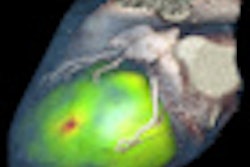
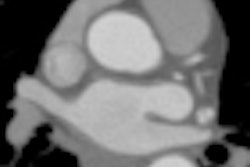
PET detects inflammation, possibly related to fatty deposits, which can signal the very early stages of aortic stenosis, or narrowing or hardening of the heart's aortic valve. The study, funded by the British Heart Foundation, found that PET provided greater insight than ultrasound into the process that causes aortic stenosis.
Currently, the only treatment for aortic stenosis is heart surgery, which may not be the best solution for many patients over the age of 65, said lead study author Dr. Marc Dweck from the University of Edinburgh's Clinical Research Imaging Centre.
The PET scans can help physicians better understand what is happening to the heart valves and potentially help them develop treatment to halt the processes causing the narrowing, Dweck added. The modality also may predict which patients are likely to need an operation, and when the condition might occur.


![Overview of the study design. (A) The fully automated deep learning framework was developed to estimate body composition (BC) (defined as subcutaneous adipose tissue [SAT] in liters; visceral adipose tissue [VAT] in liters; skeletal muscle [SM] in liters; SM fat fraction [SMFF] as a percentage; and intramuscular adipose tissue [IMAT] in deciliters) from MRI. The fully automated framework comprised one model (model 1) to quantify different BC measures (SAT, VAT, SM, SMFF, and IMAT) as three-dimensional (3D) measures from whole-body MRI scans. The second model (model 2) was trained to identify standardized anatomic landmarks along the craniocaudal body axis (z coordinate field), which allowed for subdividing the whole-body measures into different subregions typically examined on clinical routine MRI scans (chest, abdomen, and pelvis). (B) BC was quantified from whole-body MRI in over 66,000 individuals from two large population-based cohort studies, the UK Biobank (UKB) (36,317 individuals) and the German National Cohort (NAKO) (30,291 individuals). Bar graphs show age distribution by sex and cohort. BMI = body mass index. (C) After the performance assessment of the fully automated framework, the change in BC measures, distributions, and profiles across age decades were investigated. Age-, sex-, and height-adjusted body composition reference curves were calculated and made publicly available in a web-based z-score calculator (https://circ-ml.github.io).](https://img.auntminnieeurope.com/mindful/smg/workspaces/default/uploads/2026/05/body-comp.XgAjTfPj1W.jpg?auto=format%2Ccompress&dpr=2&fit=crop&h=167&q=70&w=250)


