![]()
Although conformal methods of delivery could address this issue, switching delivery techniques raises another potential problem: Will breast motion compromise the accuracy of a highly targeted radiotherapy regimen?
The considered verdict at the moment is: "We're not sure," which isn't really good enough. Patients and practitioners need a more definitive answer if methods such as intensity-modulated radiation therapy (IMRT) are to be used routinely.
A recent paper in Physics in Medicine and Biology (November 7, 2009, Vol. 54:21, pp. 6515-6534) shows how this information could be acquired using an optical sensor system. The system relies on a 3D method of optical measurement known as Fourier profilometry, in which a fringe pattern is projected onto the patient. The 3D shape of the skin surface is then recovered from the modulation of the fringes.
The optical technique has many advantages over alternative methods, said Gareth Price, a researcher in the radiotherapy physics department at the Christie NHS Foundation Trust (Manchester, U.K.) and lead author of the paper. Measurements are acquired in real-time and without exposing patients to any additional ionizing radiation. "We can analyze the surface at a typical video frequency, which is about 25 Hz. It's ideal for measuring dynamic motion, such as breathing," he told medicalphysicsweb.
The sensor system was used on 13 patients at Christie scheduled for postsurgical IMRT for breast cancer. Study subjects were divided into two groups based on breast volume for the purpose of data analysis, but all underwent the same procedure.
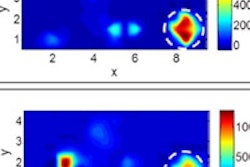
Data were acquired during treatment-beam delivery for an average of 12 fractions per patient. Video footage lasting 20 s (500 sequential surfaces) was analyzed for each patient fraction. This equated to approximately five breathing cycles. The results of the analysis were displayed as a set of three surface maps for each fraction -- one looking at the dominant frequency of motion, another focusing on motion amplitude, and the third representing the lag of each surface point with respect to a fixed marker.
In general, breast motion was found to be reasonably stable between and during treatment fractions. The motion frequency was found to be similar for both patient groups (3-5 s), though significant intrafraction variability (1-2 s) was observed in the small-breasted cohort. The mean peak-to-trough amplitude was also similar in both groups (2-4 mm).
Researchers were also able to see how the breast deformed during motion, with the inside of the sternum tending to lead the breast volume. The phase difference was greater in larger-breasted patients (about 0.4 s) than in the smaller-breasted group (about 0.3 s) as might be expected.
So does this motion make any difference to dose delivery? That's the next question to be addressed, Price said. "We can take the surface from the planning scan, change it slightly using the results we have got from this paper, do another plan and see how the dose distribution changes," he said. "We are just starting to look at this."
By Paula Gould
Medicalphysicsweb contributing editor
November 26, 2009
Related Reading
Breast IMRT without the overspill, March 3, 2008
© IOP Publishing Limited. Republished with permission from medicalphysicsweb, a community Web site covering fundamental research and emerging technologies in medical imaging and radiation therapy.