PACS has transformed the practice of radiology, but which European hospitals were the pioneers and trendsetters? In our latest history column, Dr. Adrian Thomas looks at the early days of digitization.
When I started my radiology training at London's Hammersmith Hospital in 1981, our standard for vascular investigations was the translumbar aortogram. We were taught to puncture the abdominal aorta with a large needle in anesthetized patients. The x-rays were stored in racks in large rooms, and there were drawers full of printed reports. This has all been swept away in the digital revolution.
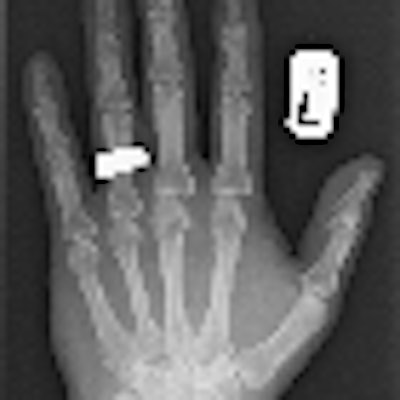
 This digital radiograph of Dr. Adrian Thomas' own hand was taken on 8 November 2005, 110 years after the discovery of x-rays. All images courtesy of Dr. Adrian Thomas.
The idea of PACS started in the early 1980s, and I came across it when the first attempt was made to create a fully filmless radiology department at St Mary's Hospital in London. Radiologist Dr. Oscar Craig had met with Harald Glass, the regional scientific officer, on 11 March 1982. Funding was requested from the U.K. Department of Health and Social Services. In June 1985, the Minister of Health promised funding. In November 1985, an article titled "Diagnostic radiology without films" was published in the Practitioner, and it described this new concept.
However, it became apparent that the technology was not adequate for the enormous task proposed. There was no filmless x-ray cassette, no clear means to rapidly transmit the vast amount of data, and little knowledge about the role of image compression. In 1987, Craig gave a talk at Hammersmith Hospital, and Dr. David Allison, head of radiology, became interested in developing an entirely filmless hospital. This was proposed in the late 1980s and coincided with technological developments. The U.K. government gave a grant in 1990, computed radiography was introduced in 1993, and the Hammersmith Hospital was filmless by 1996.
Developments were taking place in other hospitals in the rest of Europe. In the Netherlands, the Dutch PACS Project was sponsored by the Ministry of Health Care and based at Utrecht University Hospital. It ran from 1986 to 1989 and aimed to evaluate a Philips PACS prototype and to research the relationship between PACS and hospital information systems (HIS), the quality of diagnostic images and assessment of technology. The first "digital reading room" was built at Utrecht University Hospital, with the first coupling of PACS and RIS.
The complete digitization of a small medical intensive care unit was achieved, and the images and reports could be accessed at all times. Referring clinicians were very enthusiastic about the project because the radiological images were easily accessed without delay. The HIS and PACS were linked, and the reports could be viewed on the PACS workstation. It was hoped that earlier availability of radiological images would increase the speed of diagnosis and treatment, which would reduce the average length of inpatient stay. Initially it was estimated that PACS at Utrecht University Hospital would be approximately four times more expensive than conventional radiography, but by the year 2000 the cost of PACS would be the same as that of a conventional film-based system.
 Life before PACS: Stacks of conventional films are ready for reporting.
One of the few early multivendor PACS installations began in 1986 at the University Hospital of Brussels, and it involved the Multidisciplinary Research Institute for Medical Imaging Science. Staff in Brussels was concerned about communication in hospitals, and particularly communication between users and systems. They were concerned with modeling the PACS-HIS coupling, evaluating image transfer using high-speed networks, designing an adaptive user interface to increase diagnostic efficiency, and developing network structures and a multimedia software database that would enable intelligent information retrieval.
Austria's first PACS project began in 1985 as collaboration between the department of radiology at the University Hospital of Graz and Siemens. The Graz team had developed an in-house RIS, and they contacted Siemens in 1985 to initiate a PACS pilot project. The aim was for a sequential implementation that would meet the needs of both radiologists and clinicians. There would be digital acquisition, storage, and communication of radiological images from all modalities, and soft-copy reporting and filmless working was gradually introduced.
 Until PACS was introduced, conventional film packets had to be kept in huge storage rooms.
This group was probably the first in Europe to produce an operational PACS-RIS coupling, culminating at the end of the 1980s in the new Danube Hospital in Vienna, which was filmless and fully digital. It was led by Dr. Walter Hruby, the head of the radiology department, in cooperation with Siemens. The installation began in 1991, and it proved that the costs of digital radiography were no greater than a conventional department.
The changes in computing technology and its influence on radiology have been astonishing. There has been an evolutionary revolution, or as Hruby put it, "a digital (r)evolution in radiology." It has developed from a fruitful cooperation among radiology departments, industry, and government ministries. No one group could do it alone.
PACS is no longer confined to academic departments but has spread to many hospitals. It is profoundly changing all aspects of how we work. PACS gives us fast and reliable access to radiology and speeds up reporting, saves time, produces a better diagnosis, and results in an improvement in the quality of healthcare. Our film stores and racks of reports are now only a receding memory. I can only wonder what the next 10 years will bring. I am sure they will be exciting.
Dr. Adrian Thomas is chairman of the International Society for the History of Radiology and honorary librarian at the British Institute of Radiology.
The comments and observations expressed herein do not necessarily reflect the opinions of AuntMinnieEurope.com, nor should they be construed as an endorsement or admonishment of any particular vendor, analyst, industry consultant, or consulting group.
Further reading
- Hruby W, ed. Digital (r)evolution in radiology. Springer Wein/New York; 2001.
- Lemke HU, Romeny BTH. Early development of PACS in europe. In: Blaine CJ, Siegel EL, eds. PACS Design and Evaluation: Engineering and Clinical Issues. Vol. 3980. 2000.
- Thomas AMK, Banerjee AK, Busch U. Classic Papers in Modern Diagnostic Radiology. Springer Verlag; 2004.