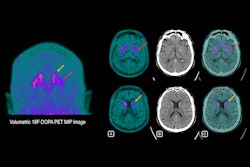
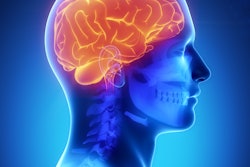
MRI illuminates the structural and functional organization of the brain -- thus helping clinicians predict the progression of Parkinson's disease in patients in its early stages, Italian researchers have found.
A team led by Silvia Basaia, PhD, of the IRCCS San Raffaele Scientific Institute in Milan, reported that Parkinson's "disease exposure" at one and two years correlated with white matter atrophy at two years and three years after baseline imaging. The results were published on 25 June in Radiology.
"[Our study found that the] brain connectome, both structural and functional, showed the potential to predict progression of gray matter alteration in patients with mild Parkinson's disease," said co-author Federica Agosta, MD, PhD, also of the institute, in a statement released by the RSNA.
Parkinson's disease can manifest as tremors, slowness of movement, or rigidity, and its symptoms worsen over time, according to the RSNA. Basaia's group explored whether a "connectome map" of structural and functional brain connections could predict Parkinson's disease progression via a study that included 86 patients with mild disease (mean age, 60 years) and 60 healthy controls (mean age, 62 years). All participants underwent 3D T1-weighted brain MRI; the team assessed the extent of regional gray matter atrophy at baseline and every year for three years.
The investigators constructed the connectome map using diffusion tensor imaging (DTI) and resting-state functional MRI (fMRI) data from the study's healthy controls. They defined disease exposure indexes -- that is, directories of the pathology of each brain region -- by evaluating the structural or functional connectivity of all the connected regions in the healthy connectome and the severity of atrophy of the connected regions in participants with Parkinson's. Finally, the authors assessed any correlations between structural and functional disease exposure indexes of each gray matter region at one- or two-year follow-up and atrophy progression at two- or three-year follow-up.
They found the following:
- Disease exposure indexes at one and two years correlated with atrophy at two and three years (p, 0.002 to 0.04).
- Disease exposure indexes predicted gray matter atrophy accumulation over three years in the right caudate nucleus and some frontal, parietal, and temporal brain regions (p < 0.001).
The results reinforce the theory that "functional and structural connections between brain regions may significantly contribute to Parkinson's disease progression," and underscore MRI's role in research regarding preventing or delaying the progression of the disease, Agosta noted.
"The idea that this approach could help identify different biomarkers capable of modulating Parkinson's disease progression inspires our work," she said.
The findings "support the concept of staged progression of Parkinson's disease," wrote Kei Yamada, MD, PhD, of Kyoto Prefectural University of Medicine in Japan in an accompanying commentary.
"[I] have no doubt that imaging studies will continue to play a pivotal role in investigating the pathophysiology of Parkinson's disease," he concluded.
The complete study can be found here.


![Overview of the study design. (A) The fully automated deep learning framework was developed to estimate body composition (BC) (defined as subcutaneous adipose tissue [SAT] in liters; visceral adipose tissue [VAT] in liters; skeletal muscle [SM] in liters; SM fat fraction [SMFF] as a percentage; and intramuscular adipose tissue [IMAT] in deciliters) from MRI. The fully automated framework comprised one model (model 1) to quantify different BC measures (SAT, VAT, SM, SMFF, and IMAT) as three-dimensional (3D) measures from whole-body MRI scans. The second model (model 2) was trained to identify standardized anatomic landmarks along the craniocaudal body axis (z coordinate field), which allowed for subdividing the whole-body measures into different subregions typically examined on clinical routine MRI scans (chest, abdomen, and pelvis). (B) BC was quantified from whole-body MRI in over 66,000 individuals from two large population-based cohort studies, the UK Biobank (UKB) (36,317 individuals) and the German National Cohort (NAKO) (30,291 individuals). Bar graphs show age distribution by sex and cohort. BMI = body mass index. (C) After the performance assessment of the fully automated framework, the change in BC measures, distributions, and profiles across age decades were investigated. Age-, sex-, and height-adjusted body composition reference curves were calculated and made publicly available in a web-based z-score calculator (https://circ-ml.github.io).](https://img.auntminnieeurope.com/mindful/smg/workspaces/default/uploads/2026/05/body-comp.XgAjTfPj1W.jpg?auto=format%2Ccompress&fit=crop&h=100&q=70&w=100)


![Overview of the study design. (A) The fully automated deep learning framework was developed to estimate body composition (BC) (defined as subcutaneous adipose tissue [SAT] in liters; visceral adipose tissue [VAT] in liters; skeletal muscle [SM] in liters; SM fat fraction [SMFF] as a percentage; and intramuscular adipose tissue [IMAT] in deciliters) from MRI. The fully automated framework comprised one model (model 1) to quantify different BC measures (SAT, VAT, SM, SMFF, and IMAT) as three-dimensional (3D) measures from whole-body MRI scans. The second model (model 2) was trained to identify standardized anatomic landmarks along the craniocaudal body axis (z coordinate field), which allowed for subdividing the whole-body measures into different subregions typically examined on clinical routine MRI scans (chest, abdomen, and pelvis). (B) BC was quantified from whole-body MRI in over 66,000 individuals from two large population-based cohort studies, the UK Biobank (UKB) (36,317 individuals) and the German National Cohort (NAKO) (30,291 individuals). Bar graphs show age distribution by sex and cohort. BMI = body mass index. (C) After the performance assessment of the fully automated framework, the change in BC measures, distributions, and profiles across age decades were investigated. Age-, sex-, and height-adjusted body composition reference curves were calculated and made publicly available in a web-based z-score calculator (https://circ-ml.github.io).](https://img.auntminnieeurope.com/mindful/smg/workspaces/default/uploads/2026/05/body-comp.XgAjTfPj1W.jpg?auto=format%2Ccompress&fit=crop&h=112&q=70&w=112)


