
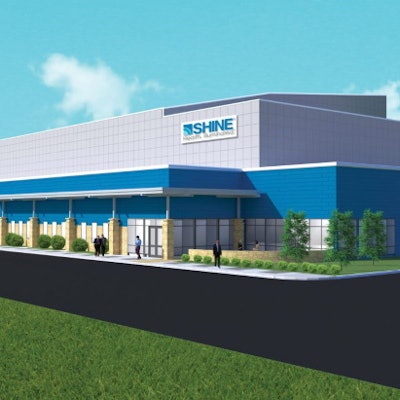
Medical isotope firm Shine Medical Technologies has secured funding for its planned new medical isotope manufacturing facility in Veendam, the Netherlands.
The advanced facility will house "state-of-the-art" production systems to produce medical isotopes such as molybdenum-99 (Mo-99), and Shine founder and Chief Executive Officer Greg Piefer offered a metaphor for comparing what's to come with current legacy systems:
"It's like comparing travel in Mercedes-Benz's first gasoline-powered car in the 1880s to an innovative journey inside today's Tesla," he said in a news release.
Shine announced the selection of Veendam in May 2021 as the location for its European isotope production facility after a search that included the review of more than 50 proposals. Construction of the Veendam facility is expected to begin in 2023.
The current phase of the project is being funded by the Province of Groningen and the Federal State of the Netherlands, Shine said.
Shine broke ground on a new 54,000-sq-ft facility in Janesville, WI, in December 2020, and also plans to produce Mo-99 there, as well as explore potential production of additional isotopes such as iodine-131 and xenon-133, among others.
Once the two facilities are operational, Shine anticipates the combined output of Mo-99 will serve up to 70% of the global need for Mo-99 used in daily diagnostic imaging, according to the company.


![Overview of the study design. (A) The fully automated deep learning framework was developed to estimate body composition (BC) (defined as subcutaneous adipose tissue [SAT] in liters; visceral adipose tissue [VAT] in liters; skeletal muscle [SM] in liters; SM fat fraction [SMFF] as a percentage; and intramuscular adipose tissue [IMAT] in deciliters) from MRI. The fully automated framework comprised one model (model 1) to quantify different BC measures (SAT, VAT, SM, SMFF, and IMAT) as three-dimensional (3D) measures from whole-body MRI scans. The second model (model 2) was trained to identify standardized anatomic landmarks along the craniocaudal body axis (z coordinate field), which allowed for subdividing the whole-body measures into different subregions typically examined on clinical routine MRI scans (chest, abdomen, and pelvis). (B) BC was quantified from whole-body MRI in over 66,000 individuals from two large population-based cohort studies, the UK Biobank (UKB) (36,317 individuals) and the German National Cohort (NAKO) (30,291 individuals). Bar graphs show age distribution by sex and cohort. BMI = body mass index. (C) After the performance assessment of the fully automated framework, the change in BC measures, distributions, and profiles across age decades were investigated. Age-, sex-, and height-adjusted body composition reference curves were calculated and made publicly available in a web-based z-score calculator (https://circ-ml.github.io).](https://img.auntminnieeurope.com/mindful/smg/workspaces/default/uploads/2026/05/body-comp.XgAjTfPj1W.jpg?auto=format%2Ccompress&fit=crop&h=112&q=70&w=112)


