Radiologists from Hamburg, Germany, have presented comprehensive new data at RSNA 2020 about the use of CT and radiography in COVID-19 cases during the first wave of the pandemic.
"Demand for imaging of suspected or proven COVID-19 patients demonstrated a distinct temporal distribution, depending on the sector of clinical care," noted lead author Dr. Jin Yamamura, PhD, professor of radiology at University Medical Center Hamburg-Eppendorf, in a digital poster displayed at RSNA 2020. "Requests for outpatients were placed later during the day and displayed a similar development to regional case data over time."
The team's study ran from 27 February (when the first COVID-19-positive patient was admitted to the hospital) to 27 May. During that period, 10,522 requests for chest imaging came from the emergency room, general wards, and intensive care units. 551 chest imaging exams (5.2% of total) were conducted because of suspected or proven COVID-19.
 Breakdown of chest imaging exams carried out in suspected or proven cases of COVID-19. ED = emergency department, GW = general wards, ICU = intensive care unit. All figures courtesy of RSNA 2020 and Dr. Jin Yamamura.
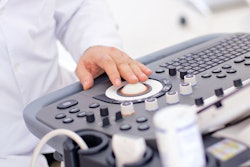
In 442 cases (94.2%), chest radiographs were conducted using a mobile x-ray machine (135/30.5% outpatients, 307/69.5% inpatients). In 27 patients (5.8%), built-in radiography systems were used (26/96.3% outpatients, 1/3.7% inpatients).
"Demands for thoracic imaging of potential or proven COVID-19 in outpatients displayed a steep increase during the second half of March; spikes in COVID-19 outpatients were followed by a slower increase in inpatient imaging requests," Yamamura and colleagues pointed out. "In relation to these findings, requests for inpatients demonstrated a delayed and slower increase."
While case reports from local authorities (or German surveillance databases) and demand for outpatient chest imaging decreased steadily from the beginning of April to the end of May, requests for inpatient chest images progressed further and persisted until the end of the study period
 Relative demand or thoracic imaging of outpatients per day and relative number of SARS-CoV-2 infections per day displayed as the percentage of the total number of requests for imaging (n = 551) and reported cases (n = 5,053) during the study period. RKI = Robert Koch Institute, a German federal government agency and research institute responsible for disease control and prevention. UKE = Universitätsklinikum Hamburg-Eppendorf.
 Relative demand for thoracic imaging of inpatients per day and relative number of SARS-CoV-2 infections per day displayed as the percentage of the total number of requests for imaging (n = 551) and reported cases (n = 5,053) during the study period.
Overall, the majority of hospitalized COVID-19 patients had contact with medical personnel of a radiology department.
The authors' time series analyses showed that demand for imaging of inpatients mostly adhered to working hours and showed a prolonged course after the number of primary diagnosed cases had already fallen. Demand for COVID-19-associated imaging displayed diurnal distribution that depended on the clinical sector of patient care, they explained.
"Our findings should be considered in the creation of staffing models in future pandemic challenges with the aim to maintain high standards in patient care and ensure staff safety," Yamamura and colleagues stated. "Time series analysis of readily available time data may be a potent tool to prepare for future pandemic scenarios."