
A multidisciplinary team led by Prof. Gail ter Haar is moving ahead with new research that seeks to advance the development of focused ultrasound therapy as a potential treatment for pancreatic cancer.
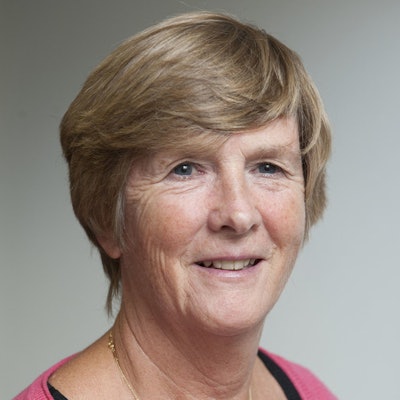
Prof. Gail ter Haar from London. Image courtesy of the ICR.Ter Haar, head of the therapy ultrasound team at the Institute of Cancer Research (ICR) Division of Radiotherapy and Imaging in London, and her colleagues will study how focused ultrasound may improve the local delivery of specially engineered viruses that target pancreatic cancer cells. They plan to use the most effective ultrasound techniques to shed light on tumor growth.
"Combining therapeutic ultrasound with new and current therapies for pancreatic cancer has exciting potential," she noted. "While a number of therapies exist for pancreatic cancer, it is clear that they are not as effective as in other cancer types because they cannot penetrate the tumor in the pancreas. We believe that ultrasound exposure of the pancreas will open up the tumor structure and allow better access for new treatment strategies, and also existing therapies, to the tumor cells. If this works as predicted, ultrasound will provide a new, minimally invasive technique for the enhancement of treatment of pancreatic cancer."
Pancreatic cancer patients have low survival rates. Less than 7% of people with pancreatic cancer in the U.K. will survive beyond five years. Evidence suggests that focused ultrasound can elicit an immune response to help the body fight the disease.
The team at ICR has developed a clinical ultrasound-guided focused ultrasound system, being the first to use this technique on cancer patients in clinical trials. The project is supported by Pancreatic Cancer UK and the Focused Ultrasound Foundation.
![Overview of the study design. (A) The fully automated deep learning framework was developed to estimate body composition (BC) (defined as subcutaneous adipose tissue [SAT] in liters; visceral adipose tissue [VAT] in liters; skeletal muscle [SM] in liters; SM fat fraction [SMFF] as a percentage; and intramuscular adipose tissue [IMAT] in deciliters) from MRI. The fully automated framework comprised one model (model 1) to quantify different BC measures (SAT, VAT, SM, SMFF, and IMAT) as three-dimensional (3D) measures from whole-body MRI scans. The second model (model 2) was trained to identify standardized anatomic landmarks along the craniocaudal body axis (z coordinate field), which allowed for subdividing the whole-body measures into different subregions typically examined on clinical routine MRI scans (chest, abdomen, and pelvis). (B) BC was quantified from whole-body MRI in over 66,000 individuals from two large population-based cohort studies, the UK Biobank (UKB) (36,317 individuals) and the German National Cohort (NAKO) (30,291 individuals). Bar graphs show age distribution by sex and cohort. BMI = body mass index. (C) After the performance assessment of the fully automated framework, the change in BC measures, distributions, and profiles across age decades were investigated. Age-, sex-, and height-adjusted body composition reference curves were calculated and made publicly available in a web-based z-score calculator (https://circ-ml.github.io).](https://img.auntminnieeurope.com/mindful/smg/workspaces/default/uploads/2026/05/body-comp.XgAjTfPj1W.jpg?auto=format%2Ccompress&fit=crop&h=100&q=70&w=100)


![Overview of the study design. (A) The fully automated deep learning framework was developed to estimate body composition (BC) (defined as subcutaneous adipose tissue [SAT] in liters; visceral adipose tissue [VAT] in liters; skeletal muscle [SM] in liters; SM fat fraction [SMFF] as a percentage; and intramuscular adipose tissue [IMAT] in deciliters) from MRI. The fully automated framework comprised one model (model 1) to quantify different BC measures (SAT, VAT, SM, SMFF, and IMAT) as three-dimensional (3D) measures from whole-body MRI scans. The second model (model 2) was trained to identify standardized anatomic landmarks along the craniocaudal body axis (z coordinate field), which allowed for subdividing the whole-body measures into different subregions typically examined on clinical routine MRI scans (chest, abdomen, and pelvis). (B) BC was quantified from whole-body MRI in over 66,000 individuals from two large population-based cohort studies, the UK Biobank (UKB) (36,317 individuals) and the German National Cohort (NAKO) (30,291 individuals). Bar graphs show age distribution by sex and cohort. BMI = body mass index. (C) After the performance assessment of the fully automated framework, the change in BC measures, distributions, and profiles across age decades were investigated. Age-, sex-, and height-adjusted body composition reference curves were calculated and made publicly available in a web-based z-score calculator (https://circ-ml.github.io).](https://img.auntminnieeurope.com/mindful/smg/workspaces/default/uploads/2026/05/body-comp.XgAjTfPj1W.jpg?auto=format%2Ccompress&fit=crop&h=112&q=70&w=112)


