
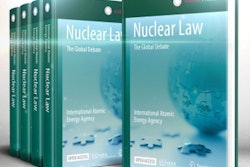
The International Atomic Energy Agency (IAEA) has published a quality control guide for SPECT/CT for nuclear medicine physicists, specialists, and radiation technologists.
The document, titled SPECT/CT Atlas of Quality Control and Image Artefacts, features three main sections:
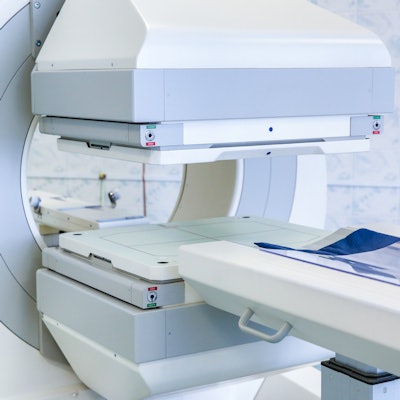
- Usage of CT and SPECT images and currently available systems
- Quality control procedures for the operation of SPECT and SPECT/CT systems in routine clinical practice
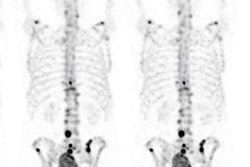
- Thirty-nine case studies of potential image artifacts from sources ranging from hardware malfunctions to user- and patient-induced artifacts
"Possible image abnormalities related to machine, user, or patient factors might not be recognized by nuclear medicine professionals, which could ultimately hinder optimal patient management," said Dr. Debbie van der Merwe, IAEA's head of the dosimetry and radiation physics section, in a statement. "The case studies illustrated in the SPECT/CT atlas will help practitioners identify and eliminate these abnormalities."


![Overview of the study design. (A) The fully automated deep learning framework was developed to estimate body composition (BC) (defined as subcutaneous adipose tissue [SAT] in liters; visceral adipose tissue [VAT] in liters; skeletal muscle [SM] in liters; SM fat fraction [SMFF] as a percentage; and intramuscular adipose tissue [IMAT] in deciliters) from MRI. The fully automated framework comprised one model (model 1) to quantify different BC measures (SAT, VAT, SM, SMFF, and IMAT) as three-dimensional (3D) measures from whole-body MRI scans. The second model (model 2) was trained to identify standardized anatomic landmarks along the craniocaudal body axis (z coordinate field), which allowed for subdividing the whole-body measures into different subregions typically examined on clinical routine MRI scans (chest, abdomen, and pelvis). (B) BC was quantified from whole-body MRI in over 66,000 individuals from two large population-based cohort studies, the UK Biobank (UKB) (36,317 individuals) and the German National Cohort (NAKO) (30,291 individuals). Bar graphs show age distribution by sex and cohort. BMI = body mass index. (C) After the performance assessment of the fully automated framework, the change in BC measures, distributions, and profiles across age decades were investigated. Age-, sex-, and height-adjusted body composition reference curves were calculated and made publicly available in a web-based z-score calculator (https://circ-ml.github.io).](https://img.auntminnieeurope.com/mindful/smg/workspaces/default/uploads/2026/05/body-comp.XgAjTfPj1W.jpg?auto=format%2Ccompress&fit=crop&h=112&q=70&w=112)


