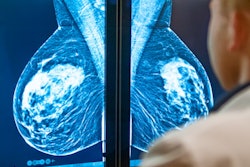
A research team led by Dr. Per Skaane, PhD, of the University of Oslo found that using synthesized 2D mammography with digital breast tomosynthesis (DBT) was the best combination for breast screening, beating more traditional techniques such as digital mammography alone or with DBT, according to results published on 19 February in Radiology.
The study data come from the Oslo Tomosynthesis Screening Trial (OTST) and demonstrate that synthesized 2D images can be trusted for screening, the researchers wrote. The sensitivity and specificity results of the trial across a variety of breast cancer screening combinations have not been previously reported.
"The use of synthetic mammography rather than digital mammography in combination with digital breast tomosynthesis resulted in little change in either sensitivity or specificity, which indicates that synthetic mammography might be a viable alternative to digital mammography when using digital breast tomosynthesis, although additional studies are needed," the group wrote.
Establishing that 2D mammography is comparable to digital mammography (DM) is important because combining DM with DBT doubles the radiation dose women receive in a mammogram, Skaane and colleagues noted.
"If synthetic mammography could be used rather than digital mammography with DBT, a screening examination could be performed at a radiation dose similar to that of digital mammography," they wrote. "There have been positive reports on the use of synthetic mammography in screening, but, to our knowledge, this study is the first large prospective trial comparing synthetic mammography and digital mammography in combination with DBT for the same set of cases."
The Oslo Tomosynthesis Screening Trial was conducted between November 2010 and December 2012, and it included 24,301 women with 281 cancers; of these, 51 were interval cancers. The trial compared digital mammography's sensitivity and specificity with those of the following mammography screening combinations:
- DM versus DM + DBT
- DM versus DM + computer-aided detection (CAD)
- DM + DBT versus synthesized 2D mammography + DBT
Mammography screening sensitivity and specificity improved when DBT was added to both DM and DBT with synthesized 2D images, the group found. Adding CAD did not produce statistically significant differences.
| Sensitivity and specificity for DM alone vs. DM + other screening modes | ||||
| Performance metric | DM alone | DM + DBT | DM + CAD | Synthesized 2D + DBT |
| Sensitivity | 54.1% | 70.5% | 56.2% | 69% |
| Specificity | 94.2% | 95% | 94.2% | 95.4% |
These particular results from the Oslo trial show promise for improving women's health, wrote Dr. Kristina Lång, PhD, in an accompanying editorial.
"If the improved sensitivity [of DBT] also leads to a subsequent reduction of the more aggressive interval cancers, it would suggest that breast tomosynthesis will have a positive effect on mortality and morbidity," she wrote.
"Overall, this study strengthens the reasonable assumption that breast tomosynthesis can improve the performance of breast cancer screening," Lång concluded.
Study disclosures
This study was supported by Hologic.