
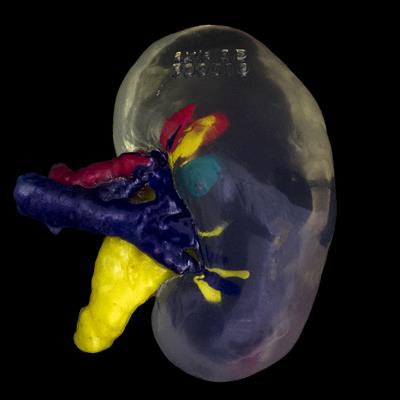
Surgeons in the U.K. collaborated with 3D printing firm Axial3D to create a patient-specific 3D-printed kidney model for use in both the preparation and completion of a kidney transplantation at Belfast City Hospital.
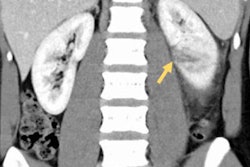
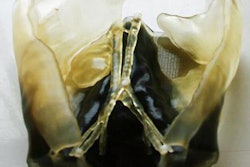
Using the 3D-printed kidney as a guide, the surgeons were able to plan the complex, two-part procedure. The surgery involved removal of a potentially cancerous cyst from a father's kidney and the same kidney's subsequent transplantation into his daughter, a patient with end-stage kidney disease.
First image: A 3D-printed kidney model. Second image: Surgeons used a 3D-printed kidney as a visual aid for removal of a cyst from the actual kidney and subsequent kidney transplantation. All images courtesy of Axial3D.Having the kidney model on hand allowed the surgeons to consider the best approach and the management of potential problems before the operation began, they said. Both the donor and recipient have recovered without incident.


![Overview of the study design. (A) The fully automated deep learning framework was developed to estimate body composition (BC) (defined as subcutaneous adipose tissue [SAT] in liters; visceral adipose tissue [VAT] in liters; skeletal muscle [SM] in liters; SM fat fraction [SMFF] as a percentage; and intramuscular adipose tissue [IMAT] in deciliters) from MRI. The fully automated framework comprised one model (model 1) to quantify different BC measures (SAT, VAT, SM, SMFF, and IMAT) as three-dimensional (3D) measures from whole-body MRI scans. The second model (model 2) was trained to identify standardized anatomic landmarks along the craniocaudal body axis (z coordinate field), which allowed for subdividing the whole-body measures into different subregions typically examined on clinical routine MRI scans (chest, abdomen, and pelvis). (B) BC was quantified from whole-body MRI in over 66,000 individuals from two large population-based cohort studies, the UK Biobank (UKB) (36,317 individuals) and the German National Cohort (NAKO) (30,291 individuals). Bar graphs show age distribution by sex and cohort. BMI = body mass index. (C) After the performance assessment of the fully automated framework, the change in BC measures, distributions, and profiles across age decades were investigated. Age-, sex-, and height-adjusted body composition reference curves were calculated and made publicly available in a web-based z-score calculator (https://circ-ml.github.io).](https://img.auntminnieeurope.com/mindful/smg/workspaces/default/uploads/2026/05/body-comp.XgAjTfPj1W.jpg?auto=format%2Ccompress&fit=crop&h=112&q=70&w=112)


