More sharing of safety events, as well as better data on contrast reactions and wider incidents, is essential if the MRI community is to learn from one another and establish good practices to help mitigate flaws in processes and human fallibility, a large study has found.
Furthermore, a national or international classification of MR-related incidents will allow clearer comparisons of practice and improved benchmarking of safety management, reported Darren Hudson, MRI clinical lead for the InHealth Group, at the recent 2017 U.K. Radiological Conference in Manchester.
"MRI is considered a safe imaging modality due to its lack of ionizing radiation. However, MRI can pose risks to staff and patients if the equipment and environment are not managed effectively," he noted.
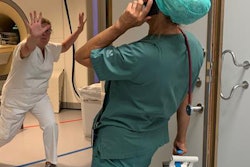
An MRI scanner's static magnetic field can exhibit a pull on ferromagnetic items, turning them into projectiles, and the radiofrequency pulses used to excite tissues can result in tissue heating and burns, Hudson explained. A scanner's switched time-varying gradients also produce high levels of acoustic noise and potential nerve stimulation.
The logging and investigation of near misses or incidents (safety events) is key so that lessons can be learned and shared to prevent serious harm from occurring, he said. This monitoring of trends and a cycle of continuous learning and improvement are vital for the assurance and delivery of safe, effective care in a culture without blame.
Data from over 70 machines
Hudson conducted an internal review of incidents over an 18-month period (dates not specified) at InHealth Group, which delivers diagnostics and managed patient services to the U.K. National Health Service in the acute and primary care settings.
The data came from more than 70 static and mobile MRI systems throughout the U.K. He pulled activity data internally from Kimera software and collated via the internal reporting system, Sentinel. Incidents were reviewed manually and categorized to identify trends using 15 subcategories to summarize the main causes of MRI safety events.
"There is little guidance on the breakdown and classification of MRI safety events," noted Hudson, adding that the subcategories were derived from previously reported data and suggestions within the U.K. Medicines and Healthcare Products Regulatory Agency guidelines from 2015.
During the period, 645,703 patients were scanned, and 1,973 MR-related incident reports were submitted. These reports accounted for 46% of all incidents documented, which was expected because this approximately equates to the same percentage of activity that MRI makes up within the company's business. The overall rate of reported incidents was 0.3%, or 1 in 327 patients.

|
|
Safety events often are multifactorial and associated with other causes, and, therefore, they may apply to more than one category, Hudson explained. He chose the root cause or most dominant category of an incident so as to identify the key aspect leading to the occurrence of an event.
MR safety events are low and tend to be underreported, and near misses are more important than actual events, he said. In his study, around 7.7% of reported MRI incidents were MRI safety-related, and the MRI-related incidence rate was 0.024%, or 1 in every 4,200 patients.
The figures for drug-related incidents indicated that 60% were reactions, representing a 1% adverse drug rate, although this is higher than expected due to data on the number of contrast examinations performed being inaccurate due to incorrect examination coding, etc., according to Hudson. Extravasations represented 20%, which is far lower in MRI compared with CT, in which a pressure injector is used more often, he continued. The remainder related to other issues, such as cardiac drug, medication management, and dynamic scan timing.
"While the adverse reaction rate was inaccurate, the percentage of contrast reaction does make up a slightly higher percentage of the reported incidents in MRI (3%) compared with the literature," he stated. "Interestingly a spike in contrast reactions was noted during a period where the usual contrast media used by the majority (of sites) was in short supply and an alternative was in increased use in its place. Extravasations accounted for 1% of the incidents."
Lack of published data
There is a lack of published data relating to incident rates and trends, Hudson continued. For instance, Dr. Mohammad Mansouri and colleagues found that 5% of hospital reports were MRI-related and the report rate was 0.35% (Journal of Magnetic Resonance Imaging, October 20, 2015).
"Whilst the incidence rate specific to MRI is in line with our findings, the total proportion is far lower due to the wider nature of workload performed in the hospital setting," Hudson pointed out.
Earlier this year, Dr. Gelareh Sadigh and colleagues looked at unexpected events in MRI and reported an occurrence rate of 16.7%, or 10.4% excluding contrast-related events.
"Their classification of an event was wider than specifically MRI safety-related, although they did specifically report on cases of unanticipated foreign bodies (3.7% of cases), which is much lower than our reported 13.8% of cases (unexpected implants and foreign bodies)," Hudson concluded.