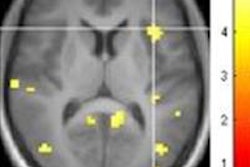
In a new study, Dutch researchers used functional MRI (fMRI) to examine people who had taken LSD to help explain how the drug distorts reality and creates perceptual illusions. Results were published online April 13 in Current Biology.
The phenomenon is known as ego dissolution, and researchers from the Royal Netherlands Academy of Arts and Sciences in Amsterdam suggest the condition occurs when regions of the brain involved in higher cognition become heavily overconnected.
"There is 'objective reality' and then there is 'our reality,' " said lead author Dr. Enzo Tagliazucchi and colleagues in a prepared statement. "Psychedelic drugs can distort our reality and result in perceptual illusions. But the reality we experience during ordinary wakefulness is also, to a large extent, an illusion."
For the study, the researchers scanned the brains of 15 healthy people while they were on LSD and compared them with fMRI scans of individuals who took a placebo.
Functional MRI showed increased global connectivity in regions such as the frontoparietal cortex, which is associated with self-consciousness. The drug also inflated the level of communication between normally distinct brain networks.
The heightened global connectivity also correlated with the degree to which the subjects reported a sense of ego dissolution.
"This could mean that LSD results in a stronger sharing of information between regions, enforcing a stronger link between our sense of self and the sense of the environment and potentially diluting the boundaries of our individuality," Tagliazucchi added.
The researchers plan to continue using neuroimaging to explore various states of consciousness, including sleep, anesthesia, and coma.


![Overview of the study design. (A) The fully automated deep learning framework was developed to estimate body composition (BC) (defined as subcutaneous adipose tissue [SAT] in liters; visceral adipose tissue [VAT] in liters; skeletal muscle [SM] in liters; SM fat fraction [SMFF] as a percentage; and intramuscular adipose tissue [IMAT] in deciliters) from MRI. The fully automated framework comprised one model (model 1) to quantify different BC measures (SAT, VAT, SM, SMFF, and IMAT) as three-dimensional (3D) measures from whole-body MRI scans. The second model (model 2) was trained to identify standardized anatomic landmarks along the craniocaudal body axis (z coordinate field), which allowed for subdividing the whole-body measures into different subregions typically examined on clinical routine MRI scans (chest, abdomen, and pelvis). (B) BC was quantified from whole-body MRI in over 66,000 individuals from two large population-based cohort studies, the UK Biobank (UKB) (36,317 individuals) and the German National Cohort (NAKO) (30,291 individuals). Bar graphs show age distribution by sex and cohort. BMI = body mass index. (C) After the performance assessment of the fully automated framework, the change in BC measures, distributions, and profiles across age decades were investigated. Age-, sex-, and height-adjusted body composition reference curves were calculated and made publicly available in a web-based z-score calculator (https://circ-ml.github.io).](https://img.auntminnieeurope.com/mindful/smg/workspaces/default/uploads/2026/05/body-comp.XgAjTfPj1W.jpg?auto=format%2Ccompress&dpr=2&fit=crop&h=167&q=70&w=250)


