A multicenter cardiac MRI study has provided fresh insight into left ventricular (LV) thrombus formation following ST-elevation myocardial infarction (STEMI). Dr. Janine Poess, a cardiologist from Lübeck, Germany, presented details of the study at the recent European Society of Cardiology (ESC) annual meeting in London.
 Dr. Janine Poess presented details of the new cardiac MRI study at the ESC congress.
Poess, from the Medical Clinic II, department of cardiology, angiology, and intensive care medicine at Luebeck University Hospital, and colleagues set out to evaluate the incidence, determinants, and clinical characteristics of LV thrombi in a large cohort of high-risk STEMI patients and assess the prognostic significance of LV thrombi at one-year follow-up. The cardiac MRI scan protocol included a 2 mmol/kg/body weight bolus of gadobutrol administered intravenously.
"The presence of LV thrombi is associated with decreased myocardial salvage, larger infarcts, and more pronounced reperfusion injury," noted Poess, who was formerly chair of the ESC's German National Young Group (German Chapter of Young Cardiologists). "Furthermore, the presence of LV thrombi was independently associated with MACE [major adverse cardiac events] at one-year follow-up."
In this multicenter cohort of patients with STEMI, thrombus prevalence was 3.5% by cardiac MRI (CMR), she told ESC 2015 delegates during a moderated poster session in London. See the table for full results.
| Cardiac MRI results | ||||
| Characteristic | Total study | No LV thrombus (n = 712) |
LV thrombus (n = 26) |
P |
| Area at risk (edema) (% LV) |
35 (25-48) | 35 (25-48) | 42 (24-51) | 0.67 |
| Infarct size (% LV) | 17 (8-25) | 16 (8-24) | 27 (24-40) | < 0.001 |
| Myocardial salvage (% LV) |
17 (9-27) | 17 (9-26) | 10 (5-20) | 0.01 |
| Myocardial salvage index | 51 (33-69) | 52 (34-70) | 27 (17-42) | < 0.001 |
| Late MO (% LV) | 0 (0-1.8) | 0 (0-1.6) | 2.7 (1.0-4.1) | 0.002 |
| LV ejection fraction (%) | 51 (43-58) | 51 (44-58) | 36 (31-47) | < 0.001 |
| LV end-diastolic volume (mL) | 146 (121-172) | 145 (120-171) | 171 (140-219) | < 0.001 |
| LV end-systolic volume (mL) | 72 (54-91) | 71 (54-90) | 112 (80-156) | < 0.001 |
This study formed part of the Abciximab Intracoronary Versus Intravenously Drug Application in STEMI (AIDA STEMI) cardiac MR trial, the aim of which was to investigate the potential benefits of intracoronary versus intravenous abciximab bolus administration on infarct size and reperfusion injury in STEMI patients.
The organizers of the trial randomized 2,065 patients to receive intracoronary or intravenous abciximab and found similar rates of major adverse cardiac events at 90 days with significantly less congestive heart failure in the intracoronary abciximab group. Cardiovascular MRI can directly visualize myocardial damage and reperfusion injury, thereby providing mechanistic and pathophysiological insights, according to the research team.
They enrolled 795 patients in the AIDA STEMI CMR substudy. Cardiac MRI examinations were completed within one week after STEMI. Central core laboratory-masked analyses for quantified ventricular function, volumes, infarct size, microvascular obstruction, hemorrhage, and myocardial salvage were performed.
A total of 738 STEMI patients reperfused by primary percutaneous coronary intervention (PCI) were enrolled at eight centers, and cardiac MRI was completed within one week, using a standardized protocol. The researchers performed central core lab-masked analyses for the presence of LV thrombi. The primary clinical end point of the study was the occurrence of MACE at one-year follow-up.
| Predictors of MACE | ||||
| Univariable | Stepwise multivariable | |||
| Variable | Hazard ratio (CI) | P | Hazard ratio (CI) | P |
| TIMI risk score | 1.05 (1.03-1.08) | < 0.001 | 1.30 (1.14-1.48) | < 0.001 |
| Smoker | 2.14 (1.12-4.1) | 0.021 | - | - |
| No. of diseased vessels | 1.42 (1.07-1.89) | 0.017 | - | - |
| Infarct size (% LV) |
1.04 (1.02-1.06) | < 0.001 | 1.03 (1.01-1.05) | 0.04 |
| LV thrombus | 3.86 (1.65-9.01) | 0.002 | 2.73 (1.11-6.73) | 0.03 |
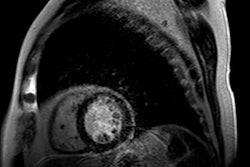
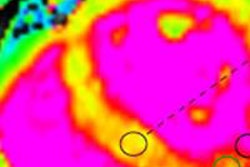
Poess also provided details of the case of a patient with transmural anterior infarction with the presence of an LV thrombus. The steady-state free precession (SSFP) image and late gadolinium-enhanced image were revealing, she noted.
During her cardiology training, she studied for a year in Perugia, Italy, as part of the Erasmus exchange program, and she also spent several months in Nice, France; Toronto, Canada; and Basel, Switzerland.