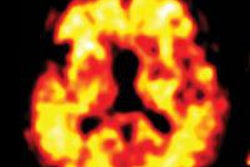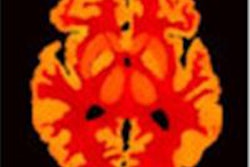
A new window into the development of Alzheimer's disease may have been opened up by researchers in Germany who have combined two noninvasive imaging techniques to study the formation of proteinaceous deposits known as b-amyloid plaques. Using both PET and MRI, the researchers followed the development of amyloid plaques in the brains of mice that have a similar disease, and found a direct connection between the plaques' formation in cerebral blood vessels and reduced blood flow in the brain.
Amyloid plaques are fibrous protein aggregates whose formation has been associated with the development of various neurodegenerative disorders. Dr. Bernd Pichler, from the Werner Siemens Imaging Center at Tübingen University, and colleagues, genetically modified mice so that the plaques would form either in the brain tissue and in the cerebral vessels (APP23 mice), or in brain tissue only (APPPS1 mice) (Nature Medicine, 10 November 2014, Vol. 20, pp. 1485-1492).
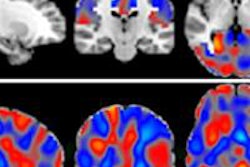
To follow the plaques' formation, the researchers used two medical imaging techniques: PET and MRI. In PET, images are built up from gamma rays that are emitted from a positron-emitting radionuclide that has been introduced into the body. In MRI, images derive from hydrogen nuclei, naturally present in the body, whose spins have been aligned with a fixed external magnetic field. The 3D composition of tissue is determined by measuring the time it takes for the nuclei to return to their original positions after they have been deflected by radio waves.
The researchers were able to obtain a high enough quality of images of live animals' brains to follow the dynamics of the disease's development spatially and temporally, and also to measure it quantitatively. They point out that this technique could also be used on human patients.
In Alzheimer's patients, doctors frequently observe reduced blood flow in certain areas of the brain. However, while Pichler's group found this symptom in the mice that had amyloid plaques in the brain tissue and in the cerebral vessels, the group did not see it in the mice that had the plaques in the brain tissue only. "Our data show that the amyloid plaque build-up in the cerebral vessels is the main factor behind the disruption of blood flow," said lead author Florian Maier, PhD student.
"We have laid the groundwork for better diagnostics, especially when it comes to distinguishing Alzheimer's-related dementia from other diseases," Pichler added. He noted the study demonstrates once again the strong link between amyloid plaques and Alzheimer's. "It would make sense to develop new treatment strategies which reduce or prevent plaque formation."
© IOP Publishing Limited. Republished with permission from medicalphysicsweb, a community website covering fundamental research and emerging technologies in medical imaging and radiation therapy.