Depression late in life could become a major risk factor for developing Alzheimer's disease faster than others, German researchers reported at the Society of Nuclear Medicine and Molecular Imaging (SNMMI) annual meeting.
A team led by Dr. Axel Rominger, of the University of Munich in Germany, found that subjects with mild cognitive impairment and depressive symptoms had elevated amyloid levels, compared with nondepressed individuals. Subjects were selected from the Alzheimer's Disease Neuroimaging Initiative database.
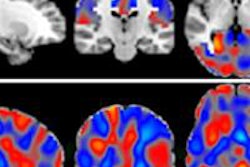
The retrospective study included 371 patients with mild cognitive impairment who had received florbetapir-PET and MRI. Patients with depressive symptoms had higher amyloid deposition as indicated by binding of the radiotracer to amyloid, particularly in the frontal cortex and the anterior and posterior cingulate gyrus of the brain.
The combination of elevated amyloid levels and coexisting depressive symptoms constitute a patient population with a high risk for faster progression to Alzheimer's disease, Rominger said in a statement.


![Overview of the study design. (A) The fully automated deep learning framework was developed to estimate body composition (BC) (defined as subcutaneous adipose tissue [SAT] in liters; visceral adipose tissue [VAT] in liters; skeletal muscle [SM] in liters; SM fat fraction [SMFF] as a percentage; and intramuscular adipose tissue [IMAT] in deciliters) from MRI. The fully automated framework comprised one model (model 1) to quantify different BC measures (SAT, VAT, SM, SMFF, and IMAT) as three-dimensional (3D) measures from whole-body MRI scans. The second model (model 2) was trained to identify standardized anatomic landmarks along the craniocaudal body axis (z coordinate field), which allowed for subdividing the whole-body measures into different subregions typically examined on clinical routine MRI scans (chest, abdomen, and pelvis). (B) BC was quantified from whole-body MRI in over 66,000 individuals from two large population-based cohort studies, the UK Biobank (UKB) (36,317 individuals) and the German National Cohort (NAKO) (30,291 individuals). Bar graphs show age distribution by sex and cohort. BMI = body mass index. (C) After the performance assessment of the fully automated framework, the change in BC measures, distributions, and profiles across age decades were investigated. Age-, sex-, and height-adjusted body composition reference curves were calculated and made publicly available in a web-based z-score calculator (https://circ-ml.github.io).](https://img.auntminnieeurope.com/mindful/smg/workspaces/default/uploads/2026/05/body-comp.XgAjTfPj1W.jpg?auto=format%2Ccompress&fit=crop&h=112&q=70&w=112)


