German and French researchers have used a novel x-ray imaging technique to improve the contrast of CT scans, permitting substantial reductions in the radiation dose, according to a new study in the Proceedings of the National Academy of Sciences.
The technique, known as x-ray grating interferometry, uses microstructures as optical elements of x-rays. It can be incorporated into CT scanners to yield virtual slice images and full 3D information about the scanned object, wrote Dr. Irene Zanette and colleagues from the European Synchrotron Radiation Facility (ESRF) in Grenoble, France, and the Technical University of Munich in Germany.
The conventional way to produce x-ray images is to shine an x-ray beam on the target object and measure the transmitted intensity behind it, a method still used in airport scans, the authors explained in a statement accompanying release of the study (PNAS, 4-8 June 2012).
"However, since this technique relies on variations in how the different constituents of an object absorb x-rays, it also has severe limitations, notably in medical x-raying where cancerous and healthy soft tissue often do not show enough contrast to be clearly distinguished," they wrote.
Grating interferometry uses both information on absorption and measurements of x-ray phase changes to produce differential phase contrast images -- density differences as small as 0.5/mg cm3 can be discerned suing grating-based phase contrast.
But the technique needed improvement. The authors of the present study incorporated a measurement protocol known in biomedicine as the sliding window technique, which "reduces the dose and acquisition time and makes grating interferometry compatible with the continuous rotation of the gantry used in clinical CT," said co-author Timm Weitkamp from Synchrotron SOLEIL, which developed the protocol.
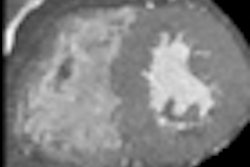
The study imaged various rat body parts, which the technique rendered in 3D minute anatomic details -- including tiny seminiferous tubules. These structures are invisible even in high-resolution CT, explained Zanette, who received an ESRF young scientist award for her work.
Along with phase contrast, interferometry can also produce so-called "dark-field" tomography images showing the presence of subpixel-size structures in the object, such as fibers, cracks, or nanosized pores. The PNAS study shows the wings of a wasp fossilized in amber. The technique can be used in medicine to show minuscule cracks in bones or soft fibers in tissue.
The simple and fast acquisition procedure makes grating interferometry an attractive technique for high-sensitivity imaging in the biomedical field, in materials science and palaeontology, and possibly in future hospital CT scanners, the authors concluded.


![Overview of the study design. (A) The fully automated deep learning framework was developed to estimate body composition (BC) (defined as subcutaneous adipose tissue [SAT] in liters; visceral adipose tissue [VAT] in liters; skeletal muscle [SM] in liters; SM fat fraction [SMFF] as a percentage; and intramuscular adipose tissue [IMAT] in deciliters) from MRI. The fully automated framework comprised one model (model 1) to quantify different BC measures (SAT, VAT, SM, SMFF, and IMAT) as three-dimensional (3D) measures from whole-body MRI scans. The second model (model 2) was trained to identify standardized anatomic landmarks along the craniocaudal body axis (z coordinate field), which allowed for subdividing the whole-body measures into different subregions typically examined on clinical routine MRI scans (chest, abdomen, and pelvis). (B) BC was quantified from whole-body MRI in over 66,000 individuals from two large population-based cohort studies, the UK Biobank (UKB) (36,317 individuals) and the German National Cohort (NAKO) (30,291 individuals). Bar graphs show age distribution by sex and cohort. BMI = body mass index. (C) After the performance assessment of the fully automated framework, the change in BC measures, distributions, and profiles across age decades were investigated. Age-, sex-, and height-adjusted body composition reference curves were calculated and made publicly available in a web-based z-score calculator (https://circ-ml.github.io).](https://img.auntminnieeurope.com/mindful/smg/workspaces/default/uploads/2026/05/body-comp.XgAjTfPj1W.jpg?auto=format%2Ccompress&dpr=2&fit=crop&h=167&q=70&w=250)


