A software tool can accurately offer automated detection and segmentation of the spleen on CT scans of malignant lymphoma patients, yielding volume measurements that correlate highly with other volumetry techniques, researchers from the University Hospital Erlangen in Germany have found.
The team found their software program, developed as part of the Theseus-Medico research program, demonstrated high correlation with both estimated splenic volume and manual volumetry methods. It was also faster and has the added advantage of being objective and reader-independent, said radiologist Dr. Matthias Hammon.
"The evaluated software supplies comparable results to splenic indexing and manual splenic volumetry without prolonging or delaying the reading process," Hammon told attendees during a session at last month's European Congress of Radiology (ECR).
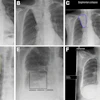
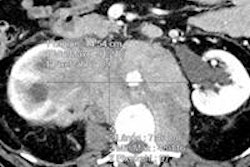
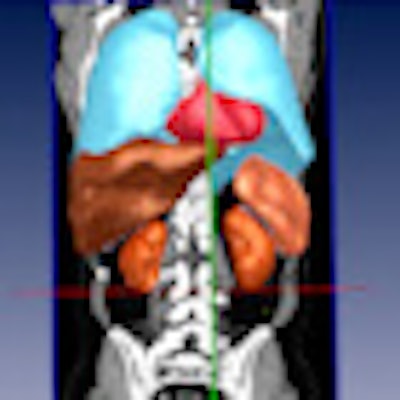
 Automated detection and volumetry of spleen (delineated with red boundary lines) in axial (top left), sagittal (top center), and coronal plane (bottom left). Automated detection and volumetry of several organs in 3D view (center bottom). Top left and top right show manual measurements of the spleen. All images courtesy of Dr. Matthias Hammon.
Since it's important for radiologists and clinicians to be able to track splenic volume over time, the researchers sought to develop a fast and accurate technique for automated detection and volumetric segmentation of the spleen on CT scans.
To be used efficiently in daily clinical routine, such software has to be able to produce the best possible volumetric result and should not delay or extend the reporting process, and the automated splenic volumetry technique would also need to be usable for all CT data, he said.
The Theseus-Medico computer-aided detection (CAD) software was developed using machine learning methods, including a probabilistic boosting tree, marginal space learning, and 3D Haar-like feature algorithms. It can complete automated volumetry of the spleen in about 15 seconds, Hammon noted.
To test the software, the researchers performed a retrospective analysis on the CT scans of 15 consecutive patients with malignant lymphoma. An experienced radiologist also determined the estimated splenic volume and performed manual volume segmentation on the three consecutive CT scans for each patient.
The team then employed correlation/regression analysis to compare the volumetric results of automated, estimated, and manual volumetry of the spleen. Correlation analysis was also performed to compare the volume changes between two consecutive CT scans determined by different methods.
Manual volumetry was used as the gold standard. Estimated splenic volumetry (splenic index) was calculated by using the equation of 30 cm3 + 0.58 (width x length x thickness). Automated volumetry was performed without any problems in all CT datasets within 15.2 seconds (± 2.4 seconds), Hammon said.
Average splenic volume:
- Automated volumetry: 268.21 cm3
- Manual volume segmentation: 281.58 cm3
- Estimated volume determination: 268.93 cm3
Correlation coefficients:
- Automated volumetry and manual volume segmentation: 0.99
- Manual volume segmentation and estimated volume segmentation: 0.91
- Automated volumetry and estimated volume segmentation: 0.91
Excellent correlation was also found tracking changes in splenic volume over two consecutive time points, with coefficients of 0.95 (automated volumetry and manual volume segmentation), 0.95 (manual volume segmentation and estimated volume segmentation), and 0.91 (automated volumetry and manual volume segmentation). All correlation values were statistically significant.
The automated volumetry provides fast and accurate splenic volumetry and is feasible for all portal-venous CT data, according to Hammon.
"It's objective and reader-independent," he said. "Also, automated volumetry is not as time consuming as the determination of the splenic index, which is often performed in daily routine, or manual segmentation."