BUDAPEST - The development of electronic record keeping and sharing has come a long way during the past 20 years, but the overall landscape remains a mess, and the fine granular data still lives on paper in hospitals, according to Dr. Dipak Kalra, professor of health informatics at University College London.
To go paperless and to make records portable and useable across different functions and national boundaries, the focus has to change, he told during a EuroRec session on strategic developments in electronic health records at the World of Health IT (WoHIT) conference in Budapest. EuroRec is an independent not-for-profit that promotes the use of electronic health records in Europe.
"We have a lot of very nice inventions to help us. We know how to structure records, we are beginning to grow competent in maintaining our privacy, and we are starting to develop systems that are interoperable," he said.
But there are also shortfalls. Pilot systems are not always scalable, and although they might produce very elegant and sophisticated solutions that are fine individually, they cannot work easily on the larger hospital- or authority-wide scale that will be needed. Crucially, they do not improve the lives of clinicians working in highly pressurized environments, and that must change, Kalra stated. And if records are to be more patient-centric, we must engage with patients, he added.
The quality of the reporting is important if the data are to be reusable. One of the areas EuroRec is now looking to develop are records that evolve across a patient's lifetime, and reflect far more than mere interaction with clinicians. Kalra fears the broader landscape of health and wellness, plus the details of the ecosystem of the patient, have been largely ignored.
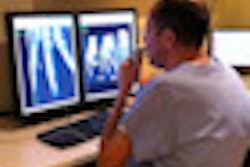
 The World of Health IT congress in Budapest attracted a healthy number of attendees between 10 and 12 May. Images courtesy of Robin Marshall.
EuroRec envisages electronic health records being used for data mining in real time so that it is possible to track the spread and development of a disease. Records would become more personalized, and even predictive. Therefore, they would feed into research and reduce the "bench to beside" timeframe that typically stands at a decade now, but that requires standards in recording, archiving, and the inter-operability of equipment. Above all, it requires utterly dependable data.
"Results must be trustworthy if we are going to put the life of a patient in the hands of an algorithm," he said.
The good news is that departments that work heavily with medical imaging do tend to provide good, useable data, particularly radiology.
"They produce reports that are organized in a methodical way. They are analytical; they describe what they see before them, such as the shape of something, or the pathology. They are predictable and have far fewer 'far out' sentences," he told AuntMinnieEurope after the session. "They don't, for example, wander off the subject into a discussion on housing needs or lifestyle, as can happen with general practitioners' letters."
When IBM began research into an electronic record-keeping project 14 years ago, it used radiology departments for that very reason, explained Kalra. And what of the images themselves?
"It's not my field, but one of my colleagues has done work on image enhancing and the augmentation of lesions, for example," he said. Beyond that, he wouldn't be drawn into what he jokingly called the "dark art" of storing images.