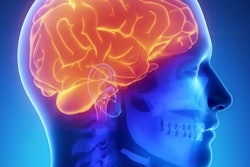
Researchers in New Zealand have used MRI to evaluate the effects of cannabis (or marijuana) on the aging brain. They presented their findings at the International Society for Magnetic Resonance in Medicine (ISMRM) annual meeting in Toronto, Canada, and our report on their work was the most viewed article on AuntMinnie.com in 2023.
For an update, we caught up with Rebecca Lee, a doctoral candidate in medical physics and imaging at the University of Otago and the New Zealand Brain Research Institute. In this video interview recorded on 8 January, she explains how and why the team conducted the study. She also comments on the impact and educational value of the research on the illicit use of cannabis.


![Overview of the study design. (A) The fully automated deep learning framework was developed to estimate body composition (BC) (defined as subcutaneous adipose tissue [SAT] in liters; visceral adipose tissue [VAT] in liters; skeletal muscle [SM] in liters; SM fat fraction [SMFF] as a percentage; and intramuscular adipose tissue [IMAT] in deciliters) from MRI. The fully automated framework comprised one model (model 1) to quantify different BC measures (SAT, VAT, SM, SMFF, and IMAT) as three-dimensional (3D) measures from whole-body MRI scans. The second model (model 2) was trained to identify standardized anatomic landmarks along the craniocaudal body axis (z coordinate field), which allowed for subdividing the whole-body measures into different subregions typically examined on clinical routine MRI scans (chest, abdomen, and pelvis). (B) BC was quantified from whole-body MRI in over 66,000 individuals from two large population-based cohort studies, the UK Biobank (UKB) (36,317 individuals) and the German National Cohort (NAKO) (30,291 individuals). Bar graphs show age distribution by sex and cohort. BMI = body mass index. (C) After the performance assessment of the fully automated framework, the change in BC measures, distributions, and profiles across age decades were investigated. Age-, sex-, and height-adjusted body composition reference curves were calculated and made publicly available in a web-based z-score calculator (https://circ-ml.github.io).](https://img.auntminnieeurope.com/mindful/smg/workspaces/default/uploads/2026/05/body-comp.XgAjTfPj1W.jpg?auto=format%2Ccompress&fit=crop&h=100&q=70&w=100)


![Overview of the study design. (A) The fully automated deep learning framework was developed to estimate body composition (BC) (defined as subcutaneous adipose tissue [SAT] in liters; visceral adipose tissue [VAT] in liters; skeletal muscle [SM] in liters; SM fat fraction [SMFF] as a percentage; and intramuscular adipose tissue [IMAT] in deciliters) from MRI. The fully automated framework comprised one model (model 1) to quantify different BC measures (SAT, VAT, SM, SMFF, and IMAT) as three-dimensional (3D) measures from whole-body MRI scans. The second model (model 2) was trained to identify standardized anatomic landmarks along the craniocaudal body axis (z coordinate field), which allowed for subdividing the whole-body measures into different subregions typically examined on clinical routine MRI scans (chest, abdomen, and pelvis). (B) BC was quantified from whole-body MRI in over 66,000 individuals from two large population-based cohort studies, the UK Biobank (UKB) (36,317 individuals) and the German National Cohort (NAKO) (30,291 individuals). Bar graphs show age distribution by sex and cohort. BMI = body mass index. (C) After the performance assessment of the fully automated framework, the change in BC measures, distributions, and profiles across age decades were investigated. Age-, sex-, and height-adjusted body composition reference curves were calculated and made publicly available in a web-based z-score calculator (https://circ-ml.github.io).](https://img.auntminnieeurope.com/mindful/smg/workspaces/default/uploads/2026/05/body-comp.XgAjTfPj1W.jpg?auto=format%2Ccompress&fit=crop&h=112&q=70&w=112)


