
Dear MRI Insider,
There is great demand for noncontrast-enhanced MR angiography techniques that can provide high image quality in a short scan time, according to researchers from Cologne, Germany.
In an e-poster presentation for this week's ECR 2020 online event, they've elaborated on their own approach to imaging of the extracranial arteries in cases of acute ischemic stroke. Don't miss our news report.
Much has been said and written about CT COVID-19 infection control over recent months, but relatively little advice has been issued about MRI -- even though some of the key issues involved in the two modalities are quite different. To correct the imbalance and promote discussion in this area, we've posted an article about how to keep MRI suites clean and safe. Three MRI specialists have shared their experiences and given us their opinions.
An important study was published last week about the neurological manifestations of severe SARS-CoV-2 infection. Researchers from University College London have evaluated the clinical, radiological, laboratory, and neuropathological findings from COVID-19 patients referred to them between 9 April and 15 May.
Meanwhile, investigators at another top London facility found that children infected with the SARS-CoV-2 virus may develop asymptomatic or mildly symptomatic COVID-19 but later experience a second, severe inflammatory illness in the brain that shows up as signal changes in the splenium of the corpus callosum on MRI.
Away from the pandemic, medical imaging professionals need to remain mindful of gadolinium's footprint and keep aware of the guidelines and evidence on gadolinium-based contrast agents (GBCAs), warn French experts. Their analysis of the main trends in GBCA usage deserves a close look.
This letter features only a handful of the many articles posted recently in the MRI Community. Please scroll through the full list below and contact me if you have any ideas for coverage.

![Overview of the study design. (A) The fully automated deep learning framework was developed to estimate body composition (BC) (defined as subcutaneous adipose tissue [SAT] in liters; visceral adipose tissue [VAT] in liters; skeletal muscle [SM] in liters; SM fat fraction [SMFF] as a percentage; and intramuscular adipose tissue [IMAT] in deciliters) from MRI. The fully automated framework comprised one model (model 1) to quantify different BC measures (SAT, VAT, SM, SMFF, and IMAT) as three-dimensional (3D) measures from whole-body MRI scans. The second model (model 2) was trained to identify standardized anatomic landmarks along the craniocaudal body axis (z coordinate field), which allowed for subdividing the whole-body measures into different subregions typically examined on clinical routine MRI scans (chest, abdomen, and pelvis). (B) BC was quantified from whole-body MRI in over 66,000 individuals from two large population-based cohort studies, the UK Biobank (UKB) (36,317 individuals) and the German National Cohort (NAKO) (30,291 individuals). Bar graphs show age distribution by sex and cohort. BMI = body mass index. (C) After the performance assessment of the fully automated framework, the change in BC measures, distributions, and profiles across age decades were investigated. Age-, sex-, and height-adjusted body composition reference curves were calculated and made publicly available in a web-based z-score calculator (https://circ-ml.github.io).](https://img.auntminnieeurope.com/mindful/smg/workspaces/default/uploads/2026/05/body-comp.XgAjTfPj1W.jpg?auto=format%2Ccompress&fit=crop&h=100&q=70&w=100)
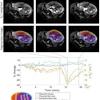


![Overview of the study design. (A) The fully automated deep learning framework was developed to estimate body composition (BC) (defined as subcutaneous adipose tissue [SAT] in liters; visceral adipose tissue [VAT] in liters; skeletal muscle [SM] in liters; SM fat fraction [SMFF] as a percentage; and intramuscular adipose tissue [IMAT] in deciliters) from MRI. The fully automated framework comprised one model (model 1) to quantify different BC measures (SAT, VAT, SM, SMFF, and IMAT) as three-dimensional (3D) measures from whole-body MRI scans. The second model (model 2) was trained to identify standardized anatomic landmarks along the craniocaudal body axis (z coordinate field), which allowed for subdividing the whole-body measures into different subregions typically examined on clinical routine MRI scans (chest, abdomen, and pelvis). (B) BC was quantified from whole-body MRI in over 66,000 individuals from two large population-based cohort studies, the UK Biobank (UKB) (36,317 individuals) and the German National Cohort (NAKO) (30,291 individuals). Bar graphs show age distribution by sex and cohort. BMI = body mass index. (C) After the performance assessment of the fully automated framework, the change in BC measures, distributions, and profiles across age decades were investigated. Age-, sex-, and height-adjusted body composition reference curves were calculated and made publicly available in a web-based z-score calculator (https://circ-ml.github.io).](https://img.auntminnieeurope.com/mindful/smg/workspaces/default/uploads/2026/05/body-comp.XgAjTfPj1W.jpg?auto=format%2Ccompress&dpr=2&fit=crop&h=167&q=70&w=250)


