Dear MRI Insider,
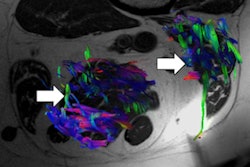
Sarcopenia, the loss of muscle mass, can be very important in older people. It's a strong predictor of mortality and may have a prognostic role in cancer patients. Also, there's a possible link among sarcopenia, osteoporosis, and hip fracture.
Unsurprisingly, therefore, new research in this area from Spain has generated huge interest. Radiologists from Seville received a cum laude award from the judges at RSNA 2018 for showing that advanced MRI sequences and associated parameters are making rapid progress and may play a future role in monitoring the progression and treatment of sarcopenia. Don't miss our news report.
Advanced MRI techniques also featured in two other RSNA 2018 presentations for which the same authors collected magna cum laude awards. You can read about this remarkable achievement.
Lego MRI came to prominence in 2015 as a way of reassuring children before their scans. A campaign is now underway to convince the Danish company to launch a commercial product, but no fewer than 10,000 supporters are needed.
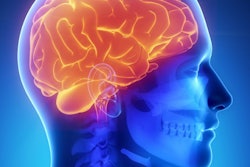
Meanwhile, investigators from Israel have highlighted the clinical potential of using automatic classification based on a single administration of MRI contrast to differentiate glioblastoma from brain metastasis. They trained a machine-learning algorithm to perform radiomics analysis of conventional, postcontrast T1-weighted MR examinations.
Did you realize that heading a football causes more brain changes on MRI scans in women than men? A team from Norway thinks the phenomenon could be related to the size and weight of the ball relative to player size. Their analysis is worth a close look.
This letter features only a few of the many articles posted over the past few weeks in the MRI Community. Please scroll through the full list of our coverage below.


![Overview of the study design. (A) The fully automated deep learning framework was developed to estimate body composition (BC) (defined as subcutaneous adipose tissue [SAT] in liters; visceral adipose tissue [VAT] in liters; skeletal muscle [SM] in liters; SM fat fraction [SMFF] as a percentage; and intramuscular adipose tissue [IMAT] in deciliters) from MRI. The fully automated framework comprised one model (model 1) to quantify different BC measures (SAT, VAT, SM, SMFF, and IMAT) as three-dimensional (3D) measures from whole-body MRI scans. The second model (model 2) was trained to identify standardized anatomic landmarks along the craniocaudal body axis (z coordinate field), which allowed for subdividing the whole-body measures into different subregions typically examined on clinical routine MRI scans (chest, abdomen, and pelvis). (B) BC was quantified from whole-body MRI in over 66,000 individuals from two large population-based cohort studies, the UK Biobank (UKB) (36,317 individuals) and the German National Cohort (NAKO) (30,291 individuals). Bar graphs show age distribution by sex and cohort. BMI = body mass index. (C) After the performance assessment of the fully automated framework, the change in BC measures, distributions, and profiles across age decades were investigated. Age-, sex-, and height-adjusted body composition reference curves were calculated and made publicly available in a web-based z-score calculator (https://circ-ml.github.io).](https://img.auntminnieeurope.com/mindful/smg/workspaces/default/uploads/2026/05/body-comp.XgAjTfPj1W.jpg?auto=format%2Ccompress&fit=crop&h=100&q=70&w=100)


![Overview of the study design. (A) The fully automated deep learning framework was developed to estimate body composition (BC) (defined as subcutaneous adipose tissue [SAT] in liters; visceral adipose tissue [VAT] in liters; skeletal muscle [SM] in liters; SM fat fraction [SMFF] as a percentage; and intramuscular adipose tissue [IMAT] in deciliters) from MRI. The fully automated framework comprised one model (model 1) to quantify different BC measures (SAT, VAT, SM, SMFF, and IMAT) as three-dimensional (3D) measures from whole-body MRI scans. The second model (model 2) was trained to identify standardized anatomic landmarks along the craniocaudal body axis (z coordinate field), which allowed for subdividing the whole-body measures into different subregions typically examined on clinical routine MRI scans (chest, abdomen, and pelvis). (B) BC was quantified from whole-body MRI in over 66,000 individuals from two large population-based cohort studies, the UK Biobank (UKB) (36,317 individuals) and the German National Cohort (NAKO) (30,291 individuals). Bar graphs show age distribution by sex and cohort. BMI = body mass index. (C) After the performance assessment of the fully automated framework, the change in BC measures, distributions, and profiles across age decades were investigated. Age-, sex-, and height-adjusted body composition reference curves were calculated and made publicly available in a web-based z-score calculator (https://circ-ml.github.io).](https://img.auntminnieeurope.com/mindful/smg/workspaces/default/uploads/2026/05/body-comp.XgAjTfPj1W.jpg?auto=format%2Ccompress&fit=crop&h=112&q=70&w=112)


