
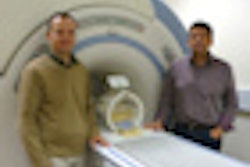
Researchers in the U.K. have developed a lightweight magnetoencephalography (MEG) prototype helmet designed to measure brain activity as people make natural movements, according to a study published online on 21 March in Nature.
The goal of the five-year, Wellcome-funded project, based at the University of Nottingham and University College London, is to advance research and treatment for patients such as young children with epilepsy or patients with neurodegenerative disorders who cannot undergo imaging by traditional fixed MEG scanners.
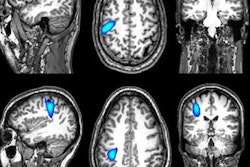
MEG is designed to map brain function by measuring the magnetic fields. The millisecond-by-millisecond images show which parts of the brain are engaged when people perform different tasks, such as speaking or moving.
This scanner features lightweight sensors mounted in a 3D-printed prototype that can be placed directly onto the scalp surface. By positioning the sensors closer to the brain, the researchers can increase the amount of signal and collect more data.
The researchers currently are working to design the helmet to more of a bicyclist style, which would be suitable for infants, children, and adults.


![Overview of the study design. (A) The fully automated deep learning framework was developed to estimate body composition (BC) (defined as subcutaneous adipose tissue [SAT] in liters; visceral adipose tissue [VAT] in liters; skeletal muscle [SM] in liters; SM fat fraction [SMFF] as a percentage; and intramuscular adipose tissue [IMAT] in deciliters) from MRI. The fully automated framework comprised one model (model 1) to quantify different BC measures (SAT, VAT, SM, SMFF, and IMAT) as three-dimensional (3D) measures from whole-body MRI scans. The second model (model 2) was trained to identify standardized anatomic landmarks along the craniocaudal body axis (z coordinate field), which allowed for subdividing the whole-body measures into different subregions typically examined on clinical routine MRI scans (chest, abdomen, and pelvis). (B) BC was quantified from whole-body MRI in over 66,000 individuals from two large population-based cohort studies, the UK Biobank (UKB) (36,317 individuals) and the German National Cohort (NAKO) (30,291 individuals). Bar graphs show age distribution by sex and cohort. BMI = body mass index. (C) After the performance assessment of the fully automated framework, the change in BC measures, distributions, and profiles across age decades were investigated. Age-, sex-, and height-adjusted body composition reference curves were calculated and made publicly available in a web-based z-score calculator (https://circ-ml.github.io).](https://img.auntminnieeurope.com/mindful/smg/workspaces/default/uploads/2026/05/body-comp.XgAjTfPj1W.jpg?auto=format%2Ccompress&dpr=2&fit=crop&h=167&q=70&w=250)
