Dear AuntMinnieEurope Member,
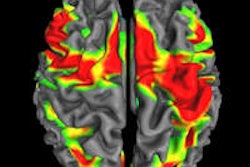
Geneva is a center of excellence for medical imaging as a whole, but researchers from the picturesque Swiss city are particularly well-informed when it comes to dementia. They're involved in a number of cutting-edge studies using MRI, PET, and other technologies.
So what exactly do radiologists need to know about dementia? How can imaging contribute to better patient care? Authors from Geneva have addressed these and other important questions. Click here to find out more.
Plagiarism is probably the greatest single challenge facing the global academic community today. It's never been easier to copy and paste material, and many people seem unaware of the dangers. To stamp out the problem, the Maverinck favors a zero-tolerance approach. Read more here.
In spite of Europe's economic difficulties, the future prospects for MRI seem relatively bright. Our review of the latest market trends focuses on three key areas of potential growth: neurology, extremity scanning, and PET/MRI. Go to our MRI Digital Community, or click here.
Too many medical students are ignorant about the potential benefits and applications of imaging, according to a survey presented at last month's U.K. Radiological Congress. For instance, only 14.4% of the survey sample said they were confident about their ability to read a chest x-ray. Find out more in our Digital X-Ray Community, or click here.
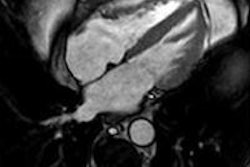
Pooled blood-volume images from dual-energy CT can be a powerful tool to differentiate clinically important pulmonary embolism from less important filling defects, and may help clinicians manage pulmonary hypertension. Visit our Cardiac Imaging Digital Community, or click here.
To date, there've only been a dozen or so cases of Middle East respiratory syndrome (MERS) in Europe, but patients often die, and the number of cases is likely to rise sharply over the coming months. Learn more about the radiological aspects of MERS here.


![Overview of the study design. (A) The fully automated deep learning framework was developed to estimate body composition (BC) (defined as subcutaneous adipose tissue [SAT] in liters; visceral adipose tissue [VAT] in liters; skeletal muscle [SM] in liters; SM fat fraction [SMFF] as a percentage; and intramuscular adipose tissue [IMAT] in deciliters) from MRI. The fully automated framework comprised one model (model 1) to quantify different BC measures (SAT, VAT, SM, SMFF, and IMAT) as three-dimensional (3D) measures from whole-body MRI scans. The second model (model 2) was trained to identify standardized anatomic landmarks along the craniocaudal body axis (z coordinate field), which allowed for subdividing the whole-body measures into different subregions typically examined on clinical routine MRI scans (chest, abdomen, and pelvis). (B) BC was quantified from whole-body MRI in over 66,000 individuals from two large population-based cohort studies, the UK Biobank (UKB) (36,317 individuals) and the German National Cohort (NAKO) (30,291 individuals). Bar graphs show age distribution by sex and cohort. BMI = body mass index. (C) After the performance assessment of the fully automated framework, the change in BC measures, distributions, and profiles across age decades were investigated. Age-, sex-, and height-adjusted body composition reference curves were calculated and made publicly available in a web-based z-score calculator (https://circ-ml.github.io).](https://img.auntminnieeurope.com/mindful/smg/workspaces/default/uploads/2026/05/body-comp.XgAjTfPj1W.jpg?auto=format%2Ccompress&fit=crop&h=100&q=70&w=100)


![Overview of the study design. (A) The fully automated deep learning framework was developed to estimate body composition (BC) (defined as subcutaneous adipose tissue [SAT] in liters; visceral adipose tissue [VAT] in liters; skeletal muscle [SM] in liters; SM fat fraction [SMFF] as a percentage; and intramuscular adipose tissue [IMAT] in deciliters) from MRI. The fully automated framework comprised one model (model 1) to quantify different BC measures (SAT, VAT, SM, SMFF, and IMAT) as three-dimensional (3D) measures from whole-body MRI scans. The second model (model 2) was trained to identify standardized anatomic landmarks along the craniocaudal body axis (z coordinate field), which allowed for subdividing the whole-body measures into different subregions typically examined on clinical routine MRI scans (chest, abdomen, and pelvis). (B) BC was quantified from whole-body MRI in over 66,000 individuals from two large population-based cohort studies, the UK Biobank (UKB) (36,317 individuals) and the German National Cohort (NAKO) (30,291 individuals). Bar graphs show age distribution by sex and cohort. BMI = body mass index. (C) After the performance assessment of the fully automated framework, the change in BC measures, distributions, and profiles across age decades were investigated. Age-, sex-, and height-adjusted body composition reference curves were calculated and made publicly available in a web-based z-score calculator (https://circ-ml.github.io).](https://img.auntminnieeurope.com/mindful/smg/workspaces/default/uploads/2026/05/body-comp.XgAjTfPj1W.jpg?auto=format%2Ccompress&fit=crop&h=112&q=70&w=112)


