
Dear AuntMinnieEurope Member,
As the year draws to a close, it's a fine time to reflect on the most popular articles published by AuntMinnieEurope during 2012.
How the imaging service was organized and delivered during the London 2012 Olympics, the potential regulatory threat to clinical MRI in the European Union, the ongoing breast screening debate, the 40th anniversary of CT, and radiology and modern art clearly piqued your interest this year.
Our list of top 10 articles, measured by the total number of page views, is given below. To access the relevant article, simply click on the title.
- MRI accounts for half of exams so far in Olympic polyclinic, 7 August 2012
- Olympics organizers release final imaging statistics, 9 November 2012
- European panel confirms value of breast screening, 13 September 2012
- Europe puts MRI rules on hold for 2 more years, 26 January 2012
- Radiology finds its place in the modern art world, 30 July 2012
- 40 years of CT: Facts you may not know about Godfrey Hounsfield, 14 May 2012
- ESUR issues new guidance on best use of prostate MRI, 24 February 2012
- Fetal MRI can complement prenatal ultrasound, 17 January 2012
- Are smartphones changing behavior in medical practice? 4 January 2012
- European vote paves the way for continued use of clinical MRI, 6 December 2012
During the past 12 months, it has been a great pleasure and privilege for us to keep you informed about the world of medical imaging. We would like to thank you for your continued support, encouragement, and participation in our site.
My colleagues and I wish you all the very best for the coming year, and we look forward to continuing to serve you in 2013.

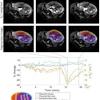
![Overview of the study design. (A) The fully automated deep learning framework was developed to estimate body composition (BC) (defined as subcutaneous adipose tissue [SAT] in liters; visceral adipose tissue [VAT] in liters; skeletal muscle [SM] in liters; SM fat fraction [SMFF] as a percentage; and intramuscular adipose tissue [IMAT] in deciliters) from MRI. The fully automated framework comprised one model (model 1) to quantify different BC measures (SAT, VAT, SM, SMFF, and IMAT) as three-dimensional (3D) measures from whole-body MRI scans. The second model (model 2) was trained to identify standardized anatomic landmarks along the craniocaudal body axis (z coordinate field), which allowed for subdividing the whole-body measures into different subregions typically examined on clinical routine MRI scans (chest, abdomen, and pelvis). (B) BC was quantified from whole-body MRI in over 66,000 individuals from two large population-based cohort studies, the UK Biobank (UKB) (36,317 individuals) and the German National Cohort (NAKO) (30,291 individuals). Bar graphs show age distribution by sex and cohort. BMI = body mass index. (C) After the performance assessment of the fully automated framework, the change in BC measures, distributions, and profiles across age decades were investigated. Age-, sex-, and height-adjusted body composition reference curves were calculated and made publicly available in a web-based z-score calculator (https://circ-ml.github.io).](https://img.auntminnieeurope.com/mindful/smg/workspaces/default/uploads/2026/05/body-comp.XgAjTfPj1W.jpg?auto=format%2Ccompress&fit=crop&h=100&q=70&w=100)


![Overview of the study design. (A) The fully automated deep learning framework was developed to estimate body composition (BC) (defined as subcutaneous adipose tissue [SAT] in liters; visceral adipose tissue [VAT] in liters; skeletal muscle [SM] in liters; SM fat fraction [SMFF] as a percentage; and intramuscular adipose tissue [IMAT] in deciliters) from MRI. The fully automated framework comprised one model (model 1) to quantify different BC measures (SAT, VAT, SM, SMFF, and IMAT) as three-dimensional (3D) measures from whole-body MRI scans. The second model (model 2) was trained to identify standardized anatomic landmarks along the craniocaudal body axis (z coordinate field), which allowed for subdividing the whole-body measures into different subregions typically examined on clinical routine MRI scans (chest, abdomen, and pelvis). (B) BC was quantified from whole-body MRI in over 66,000 individuals from two large population-based cohort studies, the UK Biobank (UKB) (36,317 individuals) and the German National Cohort (NAKO) (30,291 individuals). Bar graphs show age distribution by sex and cohort. BMI = body mass index. (C) After the performance assessment of the fully automated framework, the change in BC measures, distributions, and profiles across age decades were investigated. Age-, sex-, and height-adjusted body composition reference curves were calculated and made publicly available in a web-based z-score calculator (https://circ-ml.github.io).](https://img.auntminnieeurope.com/mindful/smg/workspaces/default/uploads/2026/05/body-comp.XgAjTfPj1W.jpg?auto=format%2Ccompress&dpr=2&fit=crop&h=167&q=70&w=250)


