X-ray findings from newborn twin babies who died came under intense scrutiny in a U.K. courtroom on 21 October, when a leading pediatric radiologist acted as an expert witness in the trial of neonatal nurse Lucy Letby.
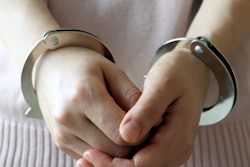
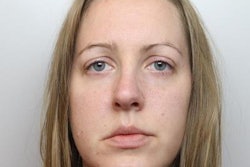
Letby stands accused of killing seven babies and attempting to murder 10 others at the Countess of Chester Hospital, north-west England, in 2015 and 2016. The 32-year-old has denied 22 charges.
Prof. Owen Arthurs, a consultant pediatric radiologist at London's Great Ormond Street Hospital and professor of radiology at the UCL Great Ormond Street Institute for Child Health, was asked to review x-rays taken of "Child A" (when alive and after death) as well as other babies in the investigation. Letby is accused of injecting air into the bloodstream of Child A, who died a day after his premature birth.
 Prof. Owen Arthurs arrives at Manchester Crown Court. Photo courtesy of PA Images/Alamy Stock Photo.
Arthurs explained to the court there was gas within the bowel -- which he said was a normal feature on postmortem x-rays -- and also within the heart, BBC News reported.
When questioned by the prosecution if there was anything unusual about the x-ray, Arthurs reported that a line of gas in front of the spine was an "unusual finding" on a postmortem x-ray of a baby, the BBC article continued.
"In my opinion this was an unusual appearance," he said. "In the absence of any other explanation, this appearance is consistent with, but not diagnostic, of air having been administered."
Arthurs -- who performs all pediatric body imaging including radiographs, ultrasound, fluoroscopy, MRI, and CT, and has a particular interest in postmortem and imaging of nonaccidental injury -- said such an image would not be seen in deaths by natural causes but had been documented in cases of road traffic accidents and sepsis infection, according to the BBC report.
He said he could not say from the image alone that an air embolism was the cause of Child A's death. When asked whether he had "ever seen this much gas in a baby that has not been explained," Arthurs is reported to have said: "only in one other case," the other instance being another baby in the murder inquiry.
Studying the evidence
He told the court his opinion is based on a 2015 peer-reviewed study that looked at how common it is that gas occurs in older children who have died -- albeit with "very few babies" included in the study, the BBC noted
Arthurs subsequently reviewed the deaths of 500 infants at Great Ormond Street. After narrowing down the criteria, the review amounted to the cases of 38 babies aged under two months. Of those, eight had gas in the greater vessels of their bodies.
He also reviewed the x-rays of Child A's twin sister, Child B, whom Letby is accused of killing by an injection of air on the following night shift at the neonatal unit, the BBC report continued. Arthurs said he found "no significant abnormalities" on her radiographic images, including on an x-ray taken 40 minutes after she suffered a sudden collapse, which Letby was responsible for, the prosecution claims.
Between June 2015 and June 2016, there were 13 unexplained deaths at the Countess of Chester's neonatal unit. At the time, a review by the Royal College of Paediatrics and Child Health said no "definitive explanation" was found for an increase in mortality rates at the hospital.
In February 2017, an internal review (currently unavailable on the hospital website) identified "no single cause" to explain the increase in neonatal deaths. However, in May 2017, doctors remained concerned over the deaths, and the National Health Service (NHS) Trust asked Cheshire Police to investigate.
The trial began on 4 October and is expected to last around six months.