Dear AuntMinnieEurope Member
VIENNA - The inaugural summer ECR drew to a close on Sunday. Vienna looked magnificent under perfect blue skies.
Switching the congress from March to July was never going to be universally popular. Advocates point to the fine weather and the value of staging a major congress when COVID rates are likely to be lower. But critics say the new timing is extremely difficult for anyone with young families or holiday plans and that the new dates conflict with other congresses.
Who better to give us her impressions of ECR 2022 than leading researcher Prof. Dr. Christiane Kuhl, PhD? In an exclusive video interview, she also spoke about research highlights in breast MRI and about how life on her small farm in Germany has been so vital in guarding against burnout.
Surely nobody is more enthusiastic about the date change than Prof. Dr. Regina Beets-Tan, president of ECR 2022. In another video interview, she makes a strong case for making the switch. She also speaks about the Dutch efforts to integrate Ukrainian radiologists and radiographers into healthcare.
Prof. Paul Parizel, president of ECR 2017, also has a positive feeling about the summer ECR. He was so keen to travel to Vienna that he was even prepared to endure a 24-hour journey from Perth, Australia.
Ultimately, however, industry will probably decide whether the new congress format is successful or not. The key question is whether the companies are prepared to back the initiative with hard cash every summer. They were certainly active partners at ECR 2022, and we asked industry analyst Sanjay Parekh to provide feedback from the exhibition hall.
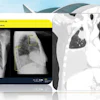
On the research side, artificial intelligence was a dominant theme throughout the congress, and developments in thoracic imaging generated considerable interest. For example, an intriguing Dutch study caught the eye of AuntMinnie.com's senior editor, Erik Ridley. Don't miss his report.
Our editorial team has very much enjoyed bringing you news and live updates throughout ECR 2022. Please take the time to check out our full coverage from the meeting.


![Overview of the study design. (A) The fully automated deep learning framework was developed to estimate body composition (BC) (defined as subcutaneous adipose tissue [SAT] in liters; visceral adipose tissue [VAT] in liters; skeletal muscle [SM] in liters; SM fat fraction [SMFF] as a percentage; and intramuscular adipose tissue [IMAT] in deciliters) from MRI. The fully automated framework comprised one model (model 1) to quantify different BC measures (SAT, VAT, SM, SMFF, and IMAT) as three-dimensional (3D) measures from whole-body MRI scans. The second model (model 2) was trained to identify standardized anatomic landmarks along the craniocaudal body axis (z coordinate field), which allowed for subdividing the whole-body measures into different subregions typically examined on clinical routine MRI scans (chest, abdomen, and pelvis). (B) BC was quantified from whole-body MRI in over 66,000 individuals from two large population-based cohort studies, the UK Biobank (UKB) (36,317 individuals) and the German National Cohort (NAKO) (30,291 individuals). Bar graphs show age distribution by sex and cohort. BMI = body mass index. (C) After the performance assessment of the fully automated framework, the change in BC measures, distributions, and profiles across age decades were investigated. Age-, sex-, and height-adjusted body composition reference curves were calculated and made publicly available in a web-based z-score calculator (https://circ-ml.github.io).](https://img.auntminnieeurope.com/mindful/smg/workspaces/default/uploads/2026/05/body-comp.XgAjTfPj1W.jpg?auto=format%2Ccompress&fit=crop&h=100&q=70&w=100)


![Overview of the study design. (A) The fully automated deep learning framework was developed to estimate body composition (BC) (defined as subcutaneous adipose tissue [SAT] in liters; visceral adipose tissue [VAT] in liters; skeletal muscle [SM] in liters; SM fat fraction [SMFF] as a percentage; and intramuscular adipose tissue [IMAT] in deciliters) from MRI. The fully automated framework comprised one model (model 1) to quantify different BC measures (SAT, VAT, SM, SMFF, and IMAT) as three-dimensional (3D) measures from whole-body MRI scans. The second model (model 2) was trained to identify standardized anatomic landmarks along the craniocaudal body axis (z coordinate field), which allowed for subdividing the whole-body measures into different subregions typically examined on clinical routine MRI scans (chest, abdomen, and pelvis). (B) BC was quantified from whole-body MRI in over 66,000 individuals from two large population-based cohort studies, the UK Biobank (UKB) (36,317 individuals) and the German National Cohort (NAKO) (30,291 individuals). Bar graphs show age distribution by sex and cohort. BMI = body mass index. (C) After the performance assessment of the fully automated framework, the change in BC measures, distributions, and profiles across age decades were investigated. Age-, sex-, and height-adjusted body composition reference curves were calculated and made publicly available in a web-based z-score calculator (https://circ-ml.github.io).](https://img.auntminnieeurope.com/mindful/smg/workspaces/default/uploads/2026/05/body-comp.XgAjTfPj1W.jpg?auto=format%2Ccompress&fit=crop&h=112&q=70&w=112)


