Is magnetic field strength a limit to MRI image resolution? Not when new sequencing approaches are implemented, according to the influential MRI researcher Dr. Graeme Bydder.
"In terms of the high-field, low-field argument, we can shift the emphasis, which is usually couched in terms of signal-to-noise ratio, to include contrast-to-noise ratio," he told attendees on 7 October at the 2021 European Society of Magnetic Resonance in Medicine and Biology (ESMRMB) virtual meeting.
Bydder, professor emeritus of radiology at the University of California, San Diego gave a tour through the past and present of low-field MRI imaging during a plenary session discussing the low and high extremes of the MRI field spectrum.
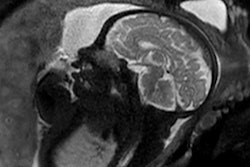
 1.5T: General Electric normal subject T1-wSE. Paul Bottomley's lab notebook and images (February 1983). Dr. Bydder said the result was "unexpected." Image courtesy of Dr. Graeme Bydder.
In the early 1980s, "field wars" kicked off in the world of MRI with the publication by GE's Paul Bottomley, PhD, that showed high quality brain images obtained at 1.5-tesla, which was 10 times the field strength most researchers were using at the time. The breakthrough led to further advances in the form of new receiver coils, low-bandwidth acquisitions, short inversion time pulse sequences, heavily T2-weighted gradient echo sequences, and motion artifact control techniques (e.g., respiratory ordered phase encoding, ROPE).
From a technical point of view, by the 1990s many of the advances made in low-field were being implemented in high-field imaging, Bydder said.
"At high-field, they performed as well or better, particularly in the case of susceptibility weighted imaging," he said.
Yet advances in low-field MRI didn't screech to a halt and today improvements are being made using the concept of tissue property filters and by using so-called "multiplied, added, subtracted and fitted inversion recovery (MASTIR) sequences," according to Bydder.
In neuroimaging, specifically, MRI tissue properties characterize underlying neurobiology and provide quantitative biomarkers for neurological disease detection and analysis. In a paper published last year, Bydder and colleagues used pulse sequences as tissue property filters as a way of understanding the signal, contrast, and weighting of MR images.
The conventional approach to weighting is qualitative and describes a sequence or an image by the tissue property most responsible for the contrast of interest using terms such as T1-weighted and T2-weighted, he explained.
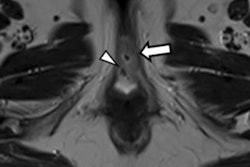
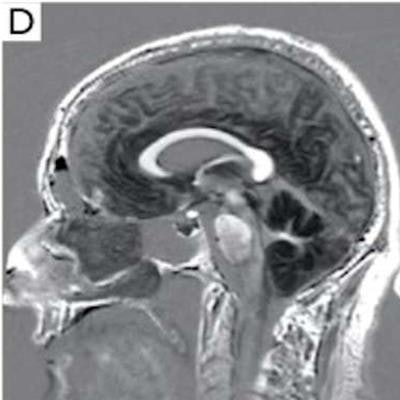
 Sagittal images of a normal brain. mTIs nulling white matter (A), mTIi nulling gray matter (B), SIR (mTIs -- mTIi) in (C) and rSIR (mTIi -- mTIs) in (D). There is high gray white matter contrast with gray matter high signal and white matter low signal in (C). In (D) the gray white matter contrast is reversed with white matter white, and gray matter black. Cerebral spinal fluid is of intermediate signal near the noise level in both (C) and (D). SIR, subtracted inversion recovery; TI, inversion time; rSIR, reversed subtraction inversion recovery. Image courtesy of Drs. Ya-Jun Ma, Hongda Shao, Shujuan Fan, Xing Lu, Jiang Du, Ian R. Young, and Graeme M. Bydder and Quantitative Imaging in Medicine and Surgery, October 2020.
The tissue properties-filters approach, on the other hand, treats pulse sequences as filters of tissue properties and shows them in graphical form, including the voxel signal S, the contrast, and the sequence weighting (slope of the filter) for each tissue property.
Ultimately, the univariate tissue property-filter model provides a mathematical framework for converting conventional qualitative univariate weighting as used in everyday clinical practice into quantitative univariate weighting.
"This gives us a different level of analyzing what we're seeing in the PGSE [pulsed-gradient spin-echo] sequence," Bydder said.
New options in low-field imaging are also available for increasing the sensitivity, specificity and scope of MRI using "multiplied, added, subtracted, and fitted inversion recovery" (MASTIR) pulse sequences, he added.
MASTIR pulse sequences are a group in which usually two or more inversion recovery (IR) images of different types are combined. IR sequences of different types can be multiplied, added, subtracted, and/or fitted together to produce variants of the MASTIR sequence.
"The sequences provide a range of options for increasing image contrast, demonstrating specific tissues and fluids of interest, and suppressing unwanted signals," Bydder said.
In addition, the basic components of MASTIR sequences are available on many commercial MR systems in the form of DIR, MP-RAGE, MP-2RAGE, IR-UTE/ZTE, DX, diffusion weighted, MT, angiography, and perfusion sequences, and these are often in time efficient form, he said.
"As a result, the entry cost for implementing MASTIR sequences may be quite low," Bydder concluded.