The amount of gadolinium found in rivers around Tokyo has risen sharply over the last two decades, in line with a rapid proliferation of MRI scanners and an increasingly aging population that receives more contrast-enhanced exams, according to research published in the May issue of Marine Pollution Bulletin.
After sampling locations in the major rivers of Tokyo, a team of researchers led by Kazumasa Inoue, PhD, of Tokyo Metropolitan University found that the amount of gadolinium had increased by as much as 6.6 times since a previous assessment over 22 years ago. Large spikes were also found in proximity to water treatment plants.
At the same time, the number of MRI scanners available in Japan has increased by nine-fold and the percentage of senior citizens living in Tokyo has also grown.
"This study demonstrated that the [gadolinium] anomaly was significantly increased in relation to raised levels of medical care," the authors wrote. "It is expected that use of [gadolinium]-based contrast agents will increase in the future. Therefore, new public policies and the development of more effective treatment technologies may be necessary to control sources and minimize future contamination."
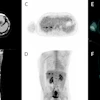
After a patient receives a gadolinium-based contrast agent for an MRI exam, 98% of the compound is removed from the body within 24 hours in urine. Common wastewater treatment plants can't remove gadolinium, however, so it's then released back into the environment, according to the authors. As lab experiments have shown that gadolinium may transform back into a toxic state after exposure to ultraviolet light, the researchers sought to track how much gadolinium has been released into the rivers around Tokyo.
They gathered samples from 40 locations along the 10 major rivers of the city and then performed a broad survey of rare earth elements in the water using mass spectrometry. After correcting for the amounts expected to be found in natural shale, the researchers found a range for anthropogenic gadolinium of 0.1-138.8 parts per thousand (ppt), with an average value of 35.5 ppt. Significant changes were particularly evident in areas downstream from wastewater treatment plants.
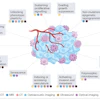
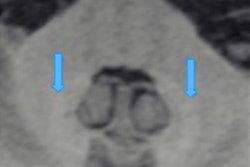
 Measurements of rare earth elements from samples taken along rivers around Tokyo indicate a clearly elevated amount of gadolinium compared with that in natural shale. Image courtesy of Tokyo Metropolitan University.
Overall, the amount of gadolinium was 5.5-6.6 times higher than previous measurements from 22 years ago, according to the researchers.
"This study highlights the [necessity] of continuous research in setting new public policies for medical practices," the authors wrote.
These results came after a nine-fold increase in the number of MRI devices between 1995 (6.1 scanners per 1 million inhabitants) and 2017 (55.2 scanners per 1 million inhabitants) in Japan. At the same time, the total population and percentage of the population aged 65 and older in Tokyo grew from 11.8 million (13% of population) in 1995 to 13.9 million (23% of population), according to the authors.
"This suggests that the increase of [anthropogenic gadolinium] depends not only on the total population but also on the increasingly aging society (i.e., the proportion of persons undergoing MRI becomes higher among older age groups) and the level of the healthcare system," they wrote.