By combining PET imaging with a radiotracer that binds to a specific protein, U.K. researchers may have validated the belief that dysfunctional neuronal connections in the brain are the underlying cause of schizophrenia, according to a study published on 14 January in Nature Communications.
The PET tracer carbon-11 (C-11) UCB-J binds to synaptic vesicle glycoprotein 2A (SV2A), which is a component of the neuronal connections, known as synapses, in the brains of schizophrenic patients. In this study, a group from the Medical Research Council (MRC) London Institute of Medical Sciences (LMS) observed a significantly lower volume of C-11 UCB-J distribution in the frontal regions of the brain that are involved in planning.
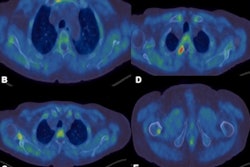
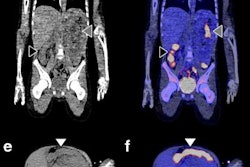
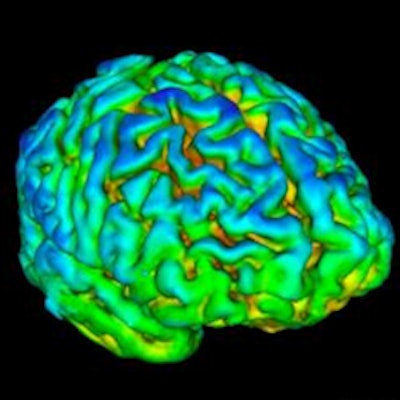
 PET scans show that 18 healthy volunteers (right) have, on average, higher levels (shown by yellow-red) of synapse marker protein SV2A than 18 study participants with schizophrenia (left). Images courtesy of Dr. Ellis Onwordi from MRC LMS.
"Our results confirm and extend postmortem evidence for lower levels of presynaptic protein markers in schizophrenia by demonstrating lower levels of SV2A in the frontal cortex and anterior cingulate cortex in vivo in schizophrenia for the first time," noted the authors, led by Dr. Oliver Howes, a professor of molecular psychiatry at MRC LMS.
The belief that schizophrenia is caused by misfiring synapses dates back to the 1980s, but research has been limited to postmortem human brain samples or animal and cell models. The advances in PET technology and the introduction of new radiotracers, such as C-11 UCB-J to target SV2A, "now [permit] in vivo investigation of presynaptic protein levels," they wrote.
For this clinical study, Howes and colleagues analyzed 18 adults with schizophrenia (mean age, 41.5 ± 2.7 years), all of whom were on antipsychotic medication, and 18 healthy volunteers (mean age, 38.7 ± 3.1 years) to determine the validity of synaptic dysfunction with schizophrenia. Subjects received approximately 300 MBq of C-11 UCB-J intravenously, followed by a 90-minute PET/CT scan (Biograph Hi-Rez, Siemens Healthineers).
The investigators hypothesized there would be less tracer uptake in the frontal cortex, anterior cingulate cortex, and hippocampus regions in those with schizophrenia, compared with the healthy controls, and those levels would be inversely associated with symptom severity. Their hypothesis was based on a 2018 meta-analysis of postmortem studies that observed less synaptophysin, also a synaptic protein, in those brain regions of schizophrenics.
Indeed, the researchers observed significantly less volume distribution of C-11 UCB-J in the frontal cortex (16.93 mL/cm3) in the schizophrenic subjects, compared with the heathy controls (19.50 mL/cm3) (p = 0.03). There also was a statistically significant difference in the anterior cingulate cortex, with schizophrenics showing less distribution (19.55 mL/cm3) than the healthy volunteers (22.49 mL/cm3) (p = 0.02). There was no significant difference in distribution between the two groups in the hippocampus.
Howes and colleagues found no correlation between C-11 UCB-J volume distribution and the severity of symptoms. This finding "could suggest that synaptic alterations occur early in the course of the illness, consistent with models that early neurodevelopment is disrupted in schizophrenia with subsequent changes in dopamine and other neurotransmitter systems leading to psychotic symptoms," they stated.
One strength of the study, they added, was the in vivo measurement of synaptic protein levels to avoid potential confounds, such as cause of death, that could affect the brain's pH and protein levels in postmortem studies. In addition, C-11 UCB-J has "shown good test-retest reproducibility, indicating it is a reliable imaging tool."