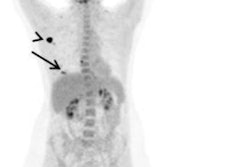
How soon after aortic prosthetic heart valve implantation can patients safely undergo FDG-PET/CT? A study presented on Tuesday at the RSNA annual meeting found that such a scan within the first 12 months is quite feasible.
The findings are important for two reasons. Researchers were able to determine consistent baseline levels of FDG uptake at three different time points within one year, which would indicate patients are recovering normally from their procedure. The results also question a European Society of Cardiology (ESC) recommendation that patients wait at least three months after implantation before undergoing an FDG-PET/CT follow-up.
"No significant change [in FDG uptake] from five weeks to one year postimplantation means that ESC should reconsider its three-month grace period," said study co-author Dr. Ricardo Budde, PhD, staff radiologist at Erasmus University Medical Center in Rotterdam, the Netherlands.
Endocarditis is an infection or inflammation of the inner lining of the heart chambers, known as the endocardium. The condition can be very deadly, given a reported hospital mortality rate of approximately 17%.
In 2015, the ESC added FDG-PET/CT to the imaging options to diagnose and characterize endocarditis in patients with a prosthetic heart valve, given FDG's attraction to and uptake by inflammation.
At the same time, however, the ESC added the caveat that the hybrid modality should only be performed at least three months after the procedure, due to tissue trauma from the surgery, which could skew normal FDG uptake.
"So, we need to know what is normal before we can determine what is abnormal," Budde told RSNA attendees. "That's why the objective of our study is to determine the normal amount of FDG uptake in patients with a prosthetic heart valve within the first year of implantation."
To determine a normal FDG uptake baseline, Budde and colleagues prospectively enrolled 37 patients and divided them into three groups. The first group included 12 patients (mean age, 65 ± 7 years) who underwent follow-up and FDG-PET/CT scans five (± 1) weeks after their prosthetic heart valve procedure. The second group consisted of 12 patients (mean age, 66 ± 8 years) who underwent the scans 12 (± 2) weeks after the procedure, and the third group included 13 patients (mean age, 67 ± 10 years) who had imaging 52 (± 8) weeks after the procedure.
"These were perfectly normal patients, except for the fact that they underwent the prosthetic heart valve implantation within the year and they had no signs of endocarditis," Budde added.
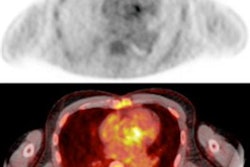
The researchers first performed a visual analysis to rate the degree of FDG uptake as low, moderate, or high in the myocardium. They then added a qualitative analysis to measure maximum standardized uptake values (SUVmax).
The visual analysis showed only mild or moderate myocardial FDG uptake in all 37 patients. No FDG-PET/CT scans resulted in no or severe uptake.
| Visual analysis of FDG uptake per patient group | |||
| Group 1 | Group 2 | Group 3 | |
| Mild uptake | 8 (67%) | 7 (58%) | 8 (62%) |
| Moderate uptake | 4 (33%) | 5 (42%) | 5 (38%) |
Budde and colleagues found no significant differences in mean SUVmax among the three groups, meaning that normal, or baseline, FDG uptake was 4.1 (± 0.7) at five weeks, 4.6 (± 0.9) at 12 weeks, and 3.8 (± 0.7) at 52 weeks.
Given the only mild or moderate FDG uptake and no significant difference in mean SUVmax in the 12 months after aortic prosthetic heart valve implantation, the researchers concluded that FDG-PET/CT is safe and feasible in the first year and recommended that the ESC reconsider its three-month grace period.