Cinematic rendering tends to be very popular with orthopedic surgeons, but radiologists from Switzerland are finding out just how tricky and time-consuming it can be to arrive at the best way to perform these reconstructions.
"For new high-definition cinematic CT reconstructions, image quality and time for reconstruction vary substantially. These depend strongly on parameters used both for the CT image reconstruction series and the quality preset applied for image generation," explained Dr. Diana Kreul and colleagues at Kantonsspital Baden AG in Baden. "Optimum choice of reconstruction parameters and image quality preset may substantially enhance efficacy in the use of cinematic reconstruction CT images."
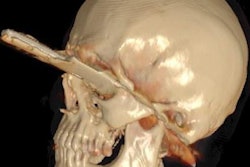
Slice thicknesses between 2 mm and 6 mm do not provide an adequate representation of fractures, they pointed out in an e-poster presentation at ECR 2019 in Vienna. With slice thicknesses of 4 mm to 6 mm, it is impossible for an inexperienced radiographer to detect a fracture in the distal radius.
 Figure 1. Reconstruction in bone window with different slice thicknesses; medium image quality. All images courtesy of Dr. Diana Kreul.
"Best reconstruction quality is given for slice thicknesses of 0.6 mm and 1 mm. ... An adequate representation of the distal radius fracture is possible for all quality levels. Consequently, a lower quality level could be used to save time during the long reconstruction period," they wrote.
Evolving method
Cinematic rendering is a relatively new image processing software for CT, and it depicts volumetric datasets in more photorealistic detail than conventional volume rendering, the authors stated.
With volume rendering, simple ray casting is performed to compute images. Only the emission and absorption of energy along a light ray are considered, and local gradient shading is used to model scattering effects. Cinematic rendering simulates a complex interaction between light and the density and associated transfer functions of the scanned object.
"The complex reconstruction algorithm currently needs enormous computer performance and IT resources to be performed sufficiently. Therefore, depending on the size of the dataset used for reconstructions, the time needed for reconstructions can vary substantially and consume more than 10 hours for larger datasets," they wrote.
In a study, they sought to evaluate the influence of reconstruction parameters from raw CT data on the quality and time/efficacy of cinematic rendering reconstructions.
They used raw data of a wrist to reconstruct CT series with different slice thicknesses (0.6 mm to 6 mm), increments (0.5 to 1), and kernels (n = 2). Cinematic reconstructions using syngo.via Frontier software (Siemens Healthineers) were created using five different quality presets (from very low to cinematic) for each series. The time to the finished reconstruction was measured and recorded. First two and then four images with 10° distance were reconstructed for each slice thickness for all image quality levels in bone and soft-tissue windows. This procedure was repeated twice to assess variance.
Reconstruction times for two images with a 10° distance varied from 20 seconds (very low image quality) to three minutes, 46 seconds, for cinematic rendering. The reconstruction of four images in the same application took about twice the time.
Huge differences existed in reconstruction quality based on slice thickness, according to the authors. Only minor differences could be depicted between the thinnest reconstructions (0.6 mm and 1 mm).
"In subjective assessment, there is no major difference between the different quality presets," they continued. "Substantial differences in time efficacy for the time-consuming cinematic reconstructions for the different quality presets could be measured. For instance, 1-mm reconstructions in bone window took 23 seconds for very low quality and 3 minutes, 36 seconds, for cinematic quality."
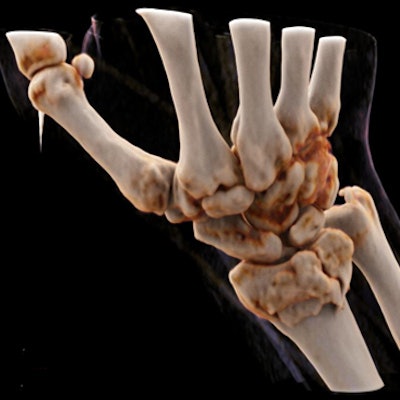
 Figure 2. Reconstruction in bone window for the same slice thickness (1 mm) with different image quality levels.
Figure 2 compares the different quality levels. "Cinematic" seems to be softer, whereas "very low" is more grainy, they found. There were no substantial differences in subjective assessment.
"Today there is only limited functionality in the syngo.via workflows regarding the cinematic reconstructions," Kreul wrote in an email to AuntMinnieEurope.com. "However, we use them especially for our orthopedic surgeons, who prefer these images for their preoperative setup. Besides, we use [cinematic rendering] for demonstration purposes of the heart and vascular reconstructions."
Research is continuing at Kantonsspital Baden to optimize the efficiency of cinematic rendering, she concluded.
To view the full e-poster, go to the Swiss exhibit in the Electronic Presentation Online System (EPOS) from ECR 2019.