A group of international researchers has highlighted that 3D printing is emerging as a key technology in the management of ear, nose, and throat conditions. In an article recently published online in Laryngoscope, they contend that the growing demand for 3D printing will bolster collaboration between radiologists and otolaryngologists.
 Dr. Chris Hong from the University of Toronto.
The group from the U.S., Canada, and Switzerland conducted a systematic review of all 3D printing research that was directly related to the field of otolaryngology and available in one of several bibliographic databases, including Medline. The researchers identified 87 clinical studies covering 710 distinct patient cases examined up to May 2018. Approximately 61% of the patients were male, and their average age was 42.8 years (Laryngoscope, January 30, 2019).
Within the field of otolaryngology, an increasing number of clinicians have started relying on 3D printing with the hope of improving various aspects of physician training and patient care. Dozens of reports and case studies have demonstrated the potential of life-sized 3D-printed models and surgical guides to make the delivery of healthcare services more effective, first author Dr. Chris Hong from the University of Toronto told AuntMinnieEurope.com.
After reviewing the literature, Hong and colleagues discovered that the otolaryngology disease entity for which 3D printing was used most often was microtia, a congenital ear deformity, with 13.2% of all cases. This was followed by squamous cell carcinoma (12.3%) and orbital wall trauma (10.7%).
With respect to clinical applications, the most widely used application of 3D printing was to aid in preoperative planning for a variety of reconstructive surgeries, most frequently for repairing the lower jaw (35.3%).
| Most common 3D printing applications for otolaryngology procedures | |
| Procedure | Proportion of procedures using 3D printing |
| Lower jaw resection, reconstruction | 35.3% |
| Ear reconstruction | 12.9% |
| Orbital reconstruction | 11.8% |
| Upper jaw resection, reconstruction | 6.9% |
| Lower jaw reduction, fixation | 3.5% |
Patient-specific 3D-printed models can benefit clinicians by enhancing their visualization and, in turn, their understanding of anatomical structures, as well as by allowing them to simulate different surgical approaches, the authors noted.
What's more, the studies showed that clinicians who examined 3D-printed models before performing procedures were able to optimize surgical interventions -- including by reducing operation times and minimizing errors and complications. 3D printing also offered many advantages over current tools in medical education, not only for residents simulating procedures but for patients during surgical consultations as well.
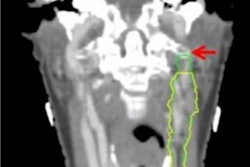
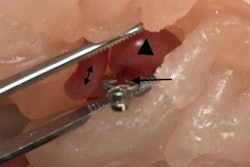
Otolaryngologists, for example, used 3D-printed models based on a patient's CT scans to simulate ear surgery for an infection caused by abnormal skin growth. In another case, radiologists and head and neck surgeons created individually tailored 3D-printed external airway splints for three infants with tracheobronchomalacia, a rare condition that causes the airway to collapse.
The wide range of clinical applications for 3D printing necessarily invites collaboration among clinicians from multiple disciplines, Hong said.
"I believe there is going to be an increased role and demand for the radiologist to postprocess images required for 3D printing of models for preoperative planning and design of patient-specific implants as healthcare moves toward personalized medicine," he said. "I believe this will directly translate to increased professional bonds between radiologists and otolaryngologists as they work together to improve patient care and surgical outcomes."