Allowing patients to wear eye shields to protect the eye lens from radiation during CT scans caused some image artifacts, but these rarely affected interpretation of the examination in a new study by researchers from Germany, published online on 15 January.
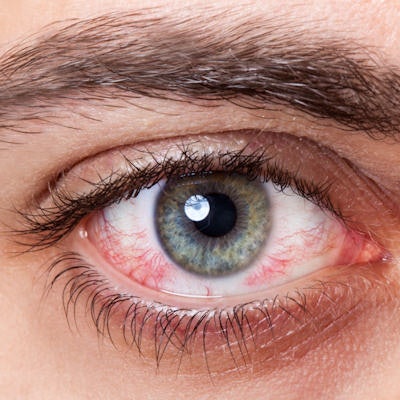
Radiation exposure to the eyes has been associated with an increased risk of cataracts, especially for patients who need to undergo repeat head CT exams. Various manufacturers have designed eye lens shields to minimize patients' exposure to radiation by as much as 64% during head CT exams, wrote lead author Dr. Stefan Schmidt and colleagues from the University Hospital of Ulm in Germany (American Journal of Roentgenology, 15 January 2019).
The trade-off is that the eye shields often prompt artifacts on CT scans, which could potentially impair diagnostic assessment, they noted. Several prior investigations by other groups have confirmed this issue with eye shields in a small sample of cases, focusing primarily on the appearance of artifacts around the eye sockets.
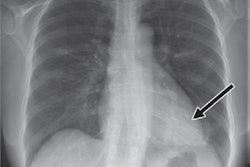
Expanding upon this preliminary research, Schmidt and colleagues acquired the head CT scans of 261 patients who wore an eye shield (CT-Eye-Protex, Somatex Medical Technologies) mounted on top of plastic glasses during the exam. The radiologists who examined the scans in the present study searched for artifacts not only near the eye socket but also in the brain and cranial bone.
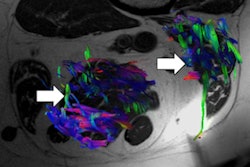
In all, they identified the presence of artifacts in 95.4% of the CT scans; 27.8% of all scans had brain artifacts and 1.9% had cranial bone artifacts. However, only 5.8% of the artifacts identified affected visualization of the brain significantly enough to increase the risk of misinterpreting the CT scan. The chief risk was a failure to detect subarachnoid bleeding due to the presence of brain artifacts.
Furthermore, the researchers discovered that clinicians had improperly positioned eye shields in 24.9% of the cases -- either too cranially (toward the face end of the skull) or too caudally (toward the posterior base end of the skull). They found that this kind of poor placement, as well as a lower number of detector rows for CT scanners, was associated with an increase in artifact occurrence.
| Association between CT artifacts in the brain and eye shield placement, scanner type | |||
| Eye shield position | |||
| Too cranial | Too caudal* | Correct | |
| Exams with brain artifacts | 81.8% | 22.2% | 34% |
| Type of CT scanner | |||
| 16-row | 64-row | 256-row | |
| Exams with brain artifacts | 40% | 21.5% | 20.8% |
Great care should be taken when positioning eye shields to protect the eye lens from radiation exposure and to avoid artifacts, the authors noted. Applying image reconstruction techniques such as iterative reconstruction to the CT scans may further reduce artifact occurrence and severity.
"Our study shows that the [eye lens] protectors have to be improved," they wrote. "Correct positioning of the protector can reduce artifacts, and this is even more important for younger patients."